1 Introduction
Over the last fifteen years our ability to study the cool gas content
of galaxies well beyond the local volume has increased dramatically
(Carilli and Walter
2013). Thanks to the development of far more sensitive radio telescopes,
primarily the Atacama Large Millimeter/Submillimeter Array (ALMA) (Wootten and
Thompson 2009), the cosmic epoch accessible to observation has
been pushed far further back. ALMA combines high resolution
and sensitivity to exploit the emission produced by cold gas tracers
(Lagache et al. 2018)
such as those used in this thesis: [CII] 158 \(\mu\)m (Crawford et al. 1985) and molecular
CO emission lines.
Taking advantage of ALMA’s resolution and sensitivity is vital to
understanding high-redshift starburst galaxies that are bright at
submillimeter wavelengths and often called submillimeter galaxies (SMGs)
(Narayanan et al. 2015). These have now been
identified for some time as likely progenitors to present epoch
elliptical galaxies (Blain et al. 2004).
Understanding of these galaxies is important to the theories of
evolution and development of modern elliptical galaxies especially the
most massive giant ellipticals in the local universe (Toft et al. 2014). A
powerful tool for discovering and interpreting the behaviour of SMGs is to
characterise their kinematics, which provides information about both
local and global properties of high-redshift starburst galaxies. In
particular, the gas velocity dispersion quantifies turbulence in the
interstellar medium and can be linked to stellar feedback and intense star
formation, while the rotation velocity is associated with the
dynamical mass and can be used to probe the dark matter content of the
galaxy.
Contrary to earlier expectations that high-redshift galaxies are
predominantly dispersion dominated (Schreiber et
al. 2009), recent observations have revealed
a population of cold, rotation-supported disc
galaxies at \(z\gtrsim 4\) (Neeleman
et al. 2020; Rizzo et al. 2020; Rizzo et al. 2021; Fraternali et al.
2021; Lelli et al. 2021). Some high-redshift galaxies may even
contain structures such as bars and bulges (Lelli et al. 2021; Rizzo et al.
2021), which until very recently was thought unlikely.
Confirmation will require the upcoming James Webb Space Telescope (JWST)
(Gardner et al. 2006) that operates at near
and mid infrared (IR) and will provide the stellar information for
galaxies at \(z\gtrsim 4\).
Carbon is the fourth most
abundant element in the universe (Stacey
et al. 2010), and combined with the high emissivity of the [CII] 158
\(\mu\)m line (Lagache et al. 2018)
this makes the emission line detectable with ALMA in SMGs at \(4\leq z\leq 6\). The line can be observed from the
ground by exploiting the submillimetre atmospheric window (Gullberg
et al. 2015). The bulk of the [CII] 158 \(\mu\)m emission arises at the boundaries
between molecular clouds and photodissociation regions (PDRs) (Stacey et al.
1991; Stacey et al. 2010), where it is the dominant cooling channel in
response to photoelectric heating from far-ultraviolet photons
(Hollenbach and Tielens
1999). The fine-structure [CII] emission line therefore traces
both atomic and molecular gas (Carilli and Walter 2013), whereas CO
traces only the molecular component. Abundant CO
observations in SMGs provide evidence for the massive reservoirs of cold
molecular gas (Scoville
et al. 1989; Sanders et al. 1991; Tacconi et
al. 2010) that galaxies at \(z
> 3\) required to produce the large stellar populations
seen in present-epoch ellipticals. CO is indeed typically used
to estimate galaxy gas masses, as it is thought to trace well
the far more abundant H\(_2\) molecular
gas, which is itself difficult to observe directly (Greve et al.
2005). A number of studies have found SMGs to be extremely gas
rich, with large reservoirs of H\(_2\)
of typical mass \(10^{10}
- 10^{11}\) M\(_\odot\) (Greve et al. 2005; Carilli et
al. 2007; Tacconi et al.
2008). This rich gas content underpins the prominent role that SMGs play in star formation in the early universe
(Narayanan et al.
2009).
In this thesis we investigate the gas kinematics of COSMOS-AzTEC-1
(hereafter AzTEC-1) with ALMA. It is an unlensed SMG at \(z=4.342\) (Tadaki et al. 2019) and an extreme
starburst galaxy, with a star formation rate \(\text{SFR} = 1186^{+36}_{-291}\) M\(_\odot\) yr\(^{-1}\) (Tadaki et
al. 2018). Like other galaxies at this redshift it has a
small angular size, with a radius of only approximately 0.5 arcseconds,
corresponding to 3.43 kpc. To achieve sufficient resolution to study such a high-redshift galaxy at radio wavelengths, we used
recent public data from the ALMA archive. These data allow us to study AzTEC-1 in two cold gas
tracers, CO and [CII], providing an opportunity to determine and
understand any differences between the kinematics of the two gases.
1.1 Previous Studies of AzTEC-1
There have been multiple previous studies in recent years of AzTEC-1
(Tadaki et al. 2018; Tadaki et
al. 2019, 2020; Sharda et al. 2019), highlighting the
excitement around such a highly resolved SMG.
Tadaki et al. (2018) found that AzTEC-1 belongs to the SMG
population dominated by regular rotation rather than velocity
dispersion, with a CO(4-3) ratio of \(V_\text{max}/\sigma_0=3.1\pm0.1\), with a
\(V_\text{max} = 227_{-6}^{+5}\) km
s\(^{-1}\) and \(\sigma_0 = 74\pm1\) km s\(^{-1}\) (Tadaki et
al. 2018). This study used the parametric code GalPaK\(^\text{3D}\) 1(Bouché et al. 2015) (see Section 1.2
for details). They analysed the molecular gas mass surface density and
found that the self-gravity of the starburst disc exceeds
the internal pressure from stellar radiation and differential
rotation. The gas disc is therefore gravitationally
unstable, and the molecular gas would be consumed by star formation on a
timescale of 10 Myr (Tadaki et
al. 2018). They argue that if JWST observations
show the stellar kinematics to be similar to the cold gas kinematics,
then galaxies like AzTEC-1 do not lose their angular
momentum at early times to become dispersion-dominated early-type
galaxies at \(z=0\). Instead, it is during
subsequent evolution, through events such as mergers, that they become the
typical massive galaxies we observe today.
A second study (Tadaki et al. 2019) used three fine-structure far-IR emission lines: [CII] 158 \(\mu\)m, [NII] 205 \(\mu\)m and [OIII] 88 \(\mu\)m. They found that the
kinematic properties of the ionised and PDR gas are very similar,
providing further confirmation that AzTEC-1’s gas disc
is rotation dominated. Photoionisation models and the measured
[OIII]/[NII] ratios gave a gas metallicity of \(Z_\text{gas}=0.7-1.0 \ Z_\odot\) (Tadaki et
al. 2020). AzTEC-1 is therefore a chemically evolved
system, consistent with other studies of star-forming SMGs (Rigopoulou et al.
2018).
In another recent paper (Sharda et al. 2019) the authors
examine the star formation rate surface brightness of both the galactic
nucleus and a star-forming clump located 2 kpc from the centre. They
use CO(4-3) emission and the kinematic modelling code \(^\textit{3D}\)BAROLO2
(Di Teodoro
and Fraternali 2015) to model the rotation of the disc, finding
\(V_\text{max}\approx220\) km s\(^{-1}\) and a gas velocity dispersion \(\sigma_0\approx50\) km s\(^{-1}\). Using the total star formation
rate determined by (Tadaki et
al. 2018) together with the measured flux, they derive
the SFR surface brightness for both the nucleus and the clump, \(\Sigma_\text{SFR}^\text{Nucleus}=270\pm54\)
M\(_\odot\) yr\(^{-1}\) and \(\Sigma_\text{SFR}^\text{Clump}=170\pm38\)
M\(_\odot\) yr\(^{-1}\). They then compare the measured
values to the predictions of different star formation relations. None
of the tested relations precisely
reproduces the measured value; the most effective is the
Salim-Federrath-Kewley (SFK) relation (Salim et al. 2015). The SFK relation
includes turbulence and the effect of magnetic fields, but the
authors were unable to make use of the magnetic term, since the magnetic field
strength is unknown for galaxies at this redshift.
A further study (Tadaki et al. 2020) examines a
non-corotating clump of cold gas. The clump shows a velocity
offset of approximately 200 km s\(^{-1}\) relative to the disc (Tadaki et al.
2020). At its distance from the galactic centre the escape
velocity is expected to be \(\sim500\)
km s\(^{-1}\). The authors
argue that AzTEC-1 is undergoing a gas-rich minor merger, and that
the velocity offset suggests the disc and clump may be
counter-rotating. Given the collisional nature of gas, this would
reduce the rotation dominance in the galaxy over time and may
represent one of the mechanisms by which SMGs become
dispersion-dominated early-type ellipticals at the present epoch.
1.2 \(^\textit{3D}\)BAROLO
In this thesis we employ the three-dimensional fitting algorithm \(^\textit{3D}\)BAROLO to study the
kinematics of AzTEC-1. The fundamental phenomenon that enables any
algorithm of this type is the
Doppler shift of line emission. When spectroscopy is performed on a single
emission line, the intrinsic rotation of the galaxy Doppler-shifts the line
across the disc, and the profiles are further broadened by
turbulence of the gas and other effects. This information is captured
in three-dimensional data cubes containing two spatial
dimensions and one spectral dimension. Taking full advantage of the
three dimensions, \(^\textit{3D}\)BAROLO reconstructs
the kinematics by fitting tilted-ring
models. It builds several models of rotating discs, convolves them
with a beam matched to the observation, and then finds the best
fit by minimising the residual between model and
data (Di
Teodoro and Fraternali 2015). The best-fit
geometric and kinematic parameters are then used to produce
the desired outputs, in particular the rotation curve and velocity dispersion
profile.
A long-standing issue with two-dimensional codes, known as beam
smearing (Bosma
1978), is avoided by the three-dimensional tilted-ring fitting
approach of \(^\textit{3D}\)BAROLO.
Beam smearing arises from the finite size of the radio telescope beam,
which causes the emission line to spread across
neighbouring regions. This produces a degeneracy in which part of the
rotation velocity is converted into line broadening and may be incorrectly
interpreted as gas velocity dispersion (Di Teodoro and Fraternali
2015). Beam smearing becomes a serious issue when the beam is
comparable in size to the observed target.
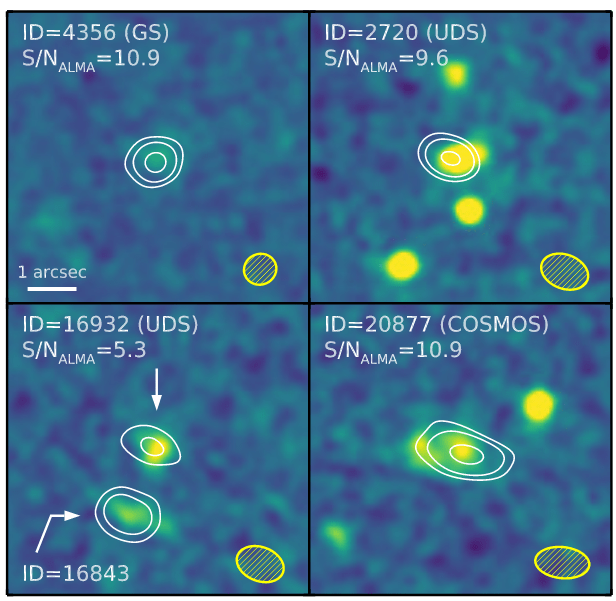
As Figure Fig. 30 shows, in galaxies at
\(z\gtrsim 4\) the beam (yellow ellipses) is
comparable in size to the objects detected by ALMA (white
contours). Without a three-dimensional approach, beam smearing would
seriously compromise determinations of the most fundamental kinematic properties, namely the rotation velocity and velocity
dispersion. \(^\textit{3D}\)BAROLO
accounts for this effect by spatially convolving the beam with the model
in each spectral channel, bringing the model to the same
angular resolution as the data (Di Teodoro and Fraternali
2015).
A key difference between \(^\textit{3D}\)BAROLO and other
three-dimensional kinematics fitting programmes such as GalPaK\(^\text{3D}\) as used in some of the studies
on AzTEC-1 (Tadaki et al. 2018; Tadaki et
al. 2019, 2020) is that GalPaK\(^\text{3D}\) is parametric and \(^\textit{3D}\)BAROLO is not. GalPaK\(^\text{3D}\) presumes a functional form for
the geometry and kinematics of the galaxy and then fits the parameters
of this form (Bouché et
al. 2015). In contrast, \(^\textit{3D}\)BAROLO is non-parametric and
measures values directly from the data, which are then interpreted. This
minimises the assumptions made prior to modelling
the galaxy, an important property when studying high-redshift galaxies that
remain poorly understood.
In this thesis we characterise the kinematics of AzTEC-1 in
the two cold gas tracers [CII] 158 \(\mu\)m and CO(4 - 3) 650 \(\mu\)m, comparing them and quantifying
the rotation and turbulence of the gas. We also examine the behaviour of the
non-corotating clump and its effect on the modelling and interpretation
of the galaxy as a whole, with the further aim of narrowing down
the possible physical origins of the clump.
We adopt a flat \(\Lambda\)CDM
cosmology throughout, with \(H_0 =
(67.4\pm0.5)\) km s\(^{-1}\)
Mpc\(^{-1}\) and \(\Omega_m=0.315\pm0.007\) (Planck-Collaboration et al. 2020). This
results in a scale of 6.860 kpc/" with a light travel time of 12.402 Gyr
(Wright 2006).
2 Methodology
In this chapter we describe the methods used to
derive kinematic models of AzTEC-1. This work relies primarily on
\(^\textit{3D}\)BAROLO, supplemented by
separate fits for parameters that \(^\textit{3D}\)BAROLO has difficulty
constraining.
2.1 Initial inspection
In this work we use ALMA public data obtained in cycle 5; the data
had been calibrated and imaged beforehand. We received two data cubes, one for [CII]
and one for CO. Each cube has spatial
axes in right ascension and declination and a spectral axis in
frequency. Table 1 lists the beam properties:
the FWHM of the major (BMAJ) and minor (BMIN) axes, the channel
separation of each cube, and the noise per channel.
We then inspected the data cubes using KVIS and KPVSLICE from the
KARMA3 package of data visualisation tools
(Gooch 1996). Each
cube contains 85 channels covering the line emission, with several
emission-free channels at either end. We determined the r.m.s. noise
\((\sigma)\) per channel
in KVIS and overlaid contours at multiples of \(2\sigma\), which allowed the
galaxy emission to be clearly distinguished from the
background. For both cubes, the spectral channels containing
genuine galactic emission were identified by visual inspection. PYTHON and the
SPECTRAL-CUBE4 component of the ASTROPY project (Robitaille et al. 2013; Price-Whelan et al. 2018) were used to
remove the excess spectral channels on either side of the galactic
emission. We then
cropped the cubes spatially to remove regions free of AzTEC-1 emission, reducing the area containing only background noise in each channel.
KVIS was also used to obtain initial estimates of the galactic centre
in pixels. KPVSLICE was used to inspect the 1st moment map of the data,
from which we estimated an initial position angle for the
galaxy in both emission lines. The systemic frequency was determined
with \(^\textit{3D}\)BAROLO as the
centre of the global line-emission profile.
| BMAJ ["] | BMIN ["] | Channel Separation [MHz] | \(\mathbf{\sigma}\) [Jy beam\(^{-1}\)] | |
|---|---|---|---|---|
| CII | 0.2038 | 0.1808 | 7.812 | \(9\times10^{-4}\) |
| CO | 0.2048 | 0.1886 | 2.015 | \(2\times10^{-4}\) |
2.2 Redshift calculation
We calculate the systemic redshift of the galaxy by comparing the fitted systemic frequency with the known rest-frame frequency (Cimatti et al. 2019) of the [CII] 158 \(\mu\)m and CO(4 - 3) 650 \(\mu\)m (\(\nu_\text{rest} = 461.040\) GHz (Papadopoulos et al. 2000)). The more precise wavelength of [CII] 157.74 \(\mu\)m (\(\nu_\text{rest} = 1900.548\) GHz) (Cooksy et al. 1986) is used for these calculations.
We then averaged the systemic redshifts found for the two emission lines to give our final observed value; these results are listed in Table 3. The uncertainties are derived from the standard deviation of the per-ring fitted systemic frequencies returned by \(^\textit{3D}\)BAROLO, which yields a very small uncertainty on the redshift.
2.3 MCMC inclination & centre fitting
Although \(^\textit{3D}\)BAROLO offers
an option for fitting galaxy inclinations, it struggles
to constrain inclination for galaxies like AzTEC-1 with small angular size. We therefore use a
Markov Chain Monte Carlo (MCMC) sampling algorithm under development by F.
Fraternali, called BUSSIA, to find the inclination of the galaxy.
BUSSIA uses the GALMOD task within \(^\textit{3D}\)BAROLO to create
three-dimensional tilted-ring models for different values of the centre
and inclination angle. A total flux map is extracted from these
models after convolution with the observing beam. The residuals between data and model form the core of the likelihood, and
the MCMC technique (Foreman-Mackey et al. 2013)
is used to find the centre and inclination that minimise these
residuals. The code has been tested on a number of
artificial galaxies spanning a range of inclinations, signal-to-noise ratios and spatial resolutions, including artificial cubes with
as few resolution elements across the disc as the galaxy studied here. These tests show excellent
performance at retrieving the input inclination whenever it lies
between \(30\degree\) and \(80\degree\), and the code returns
realistic uncertainties.
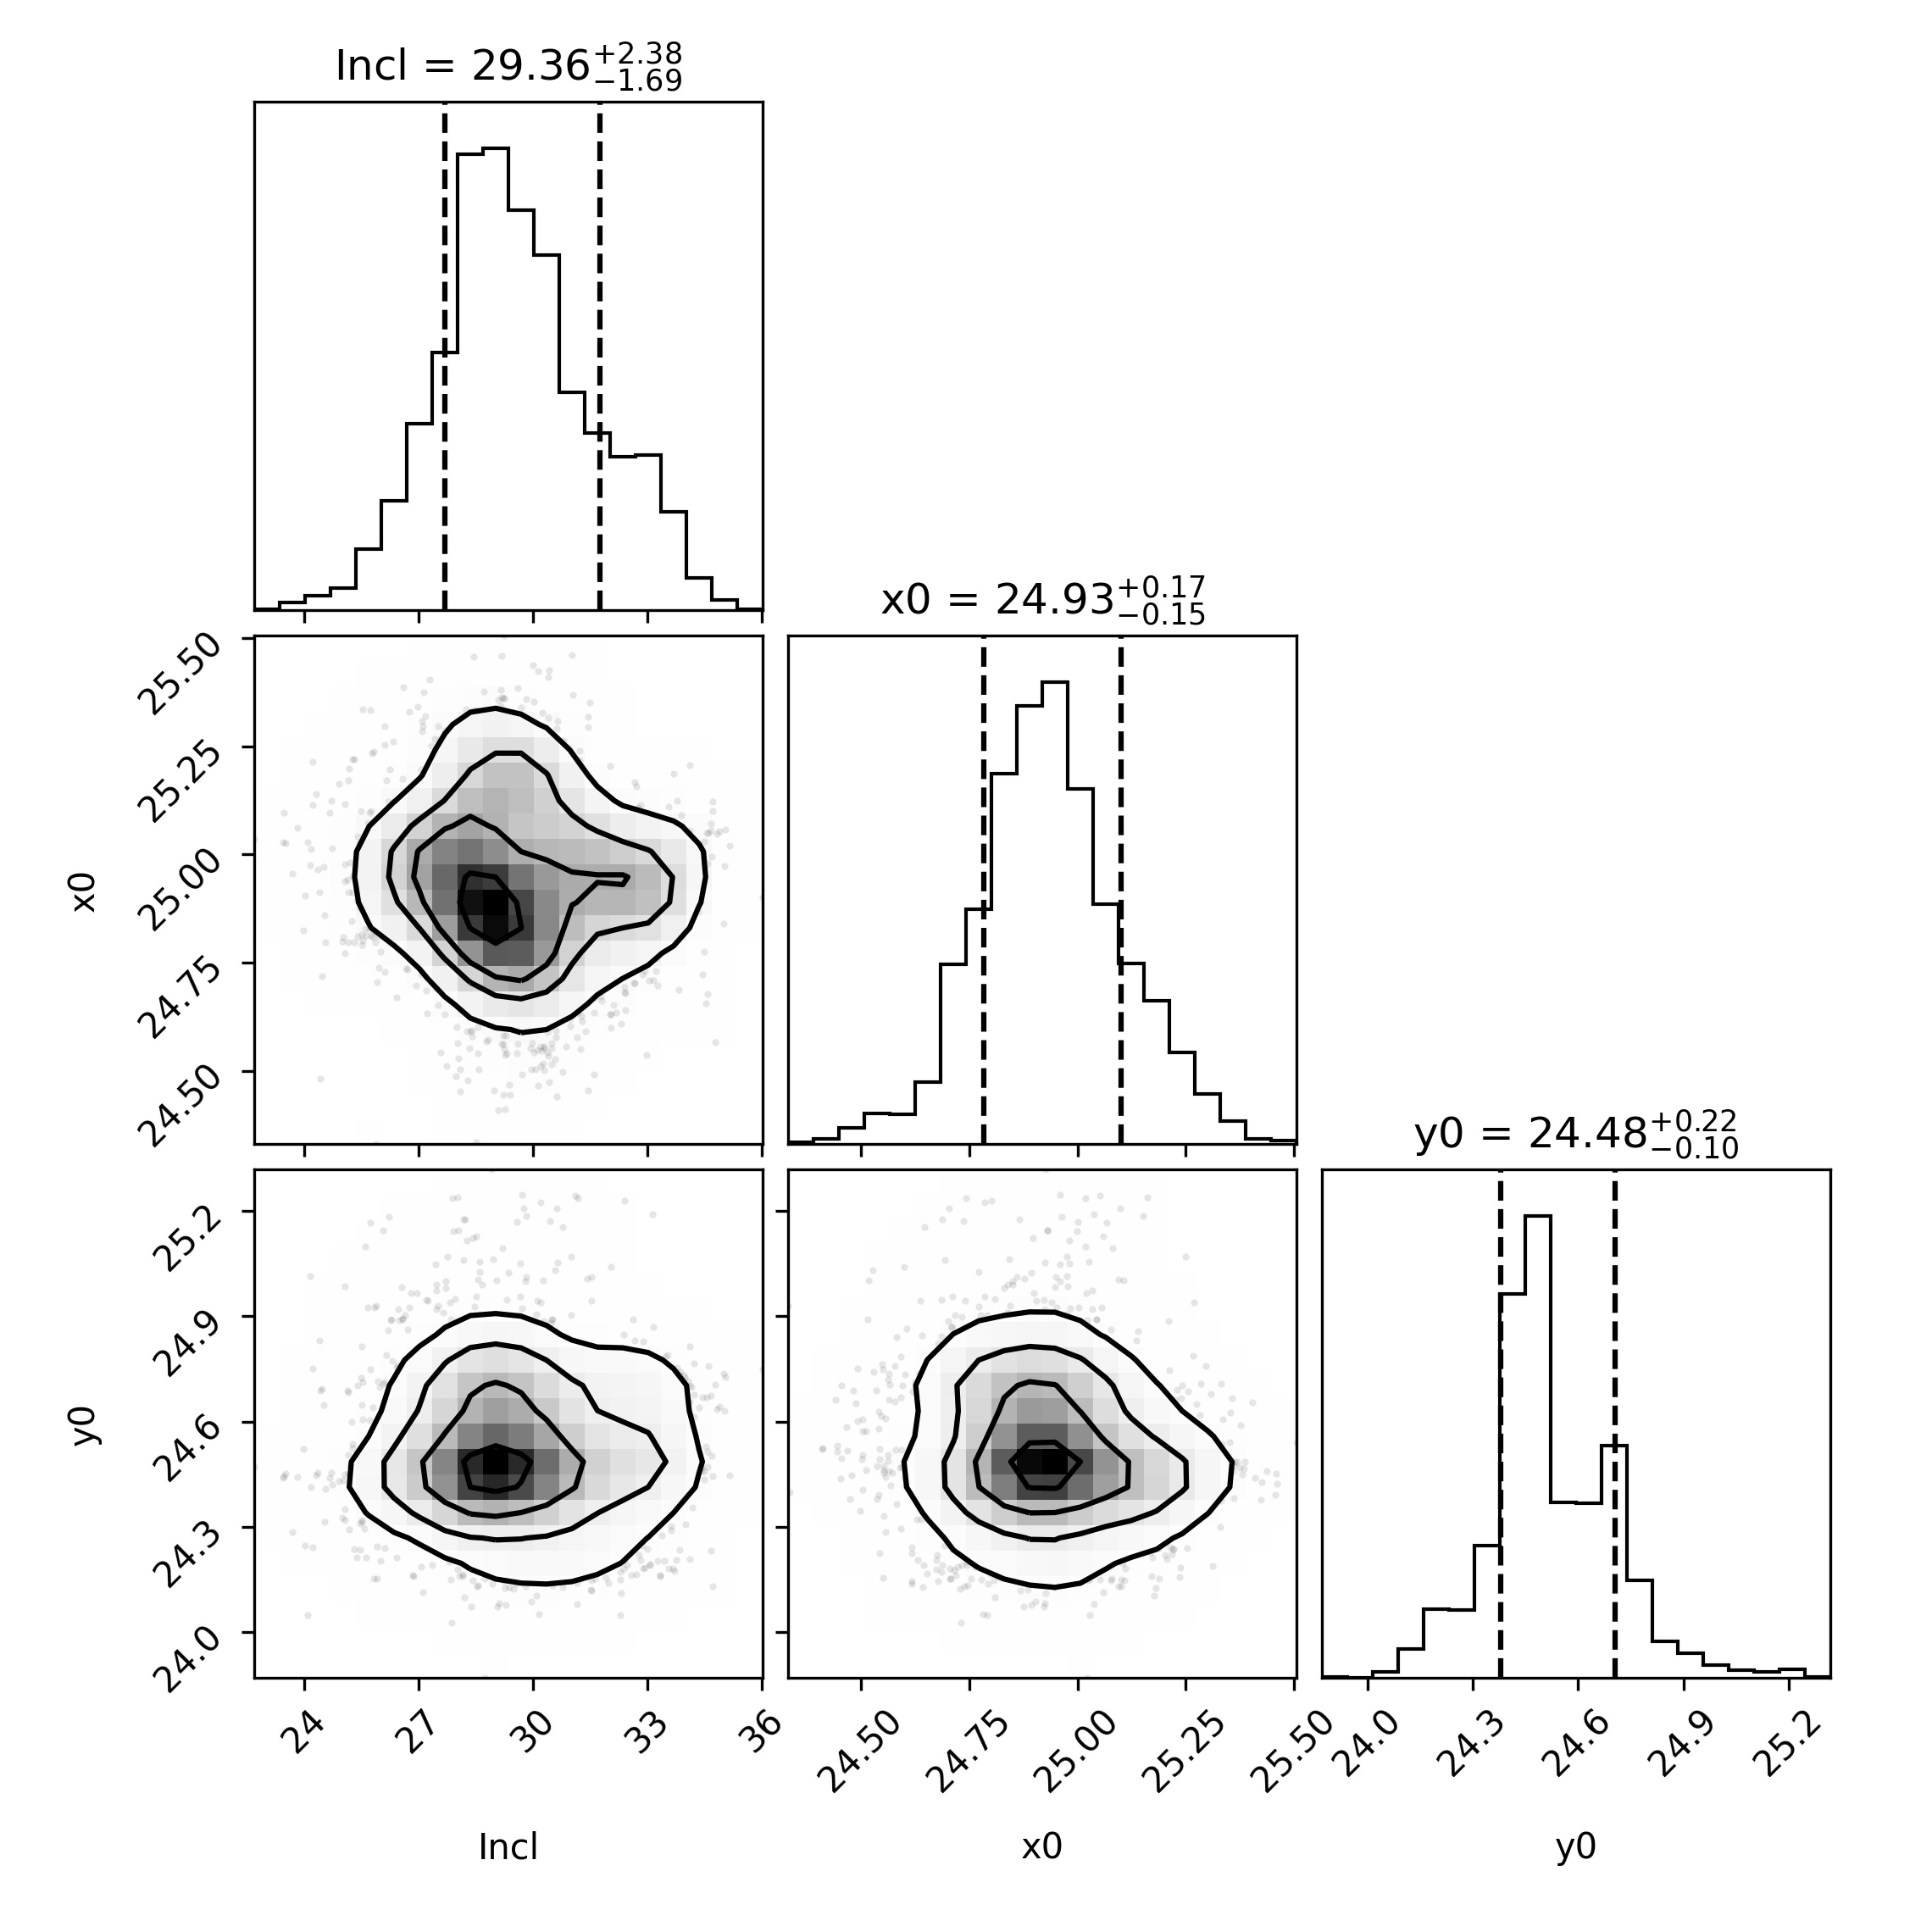
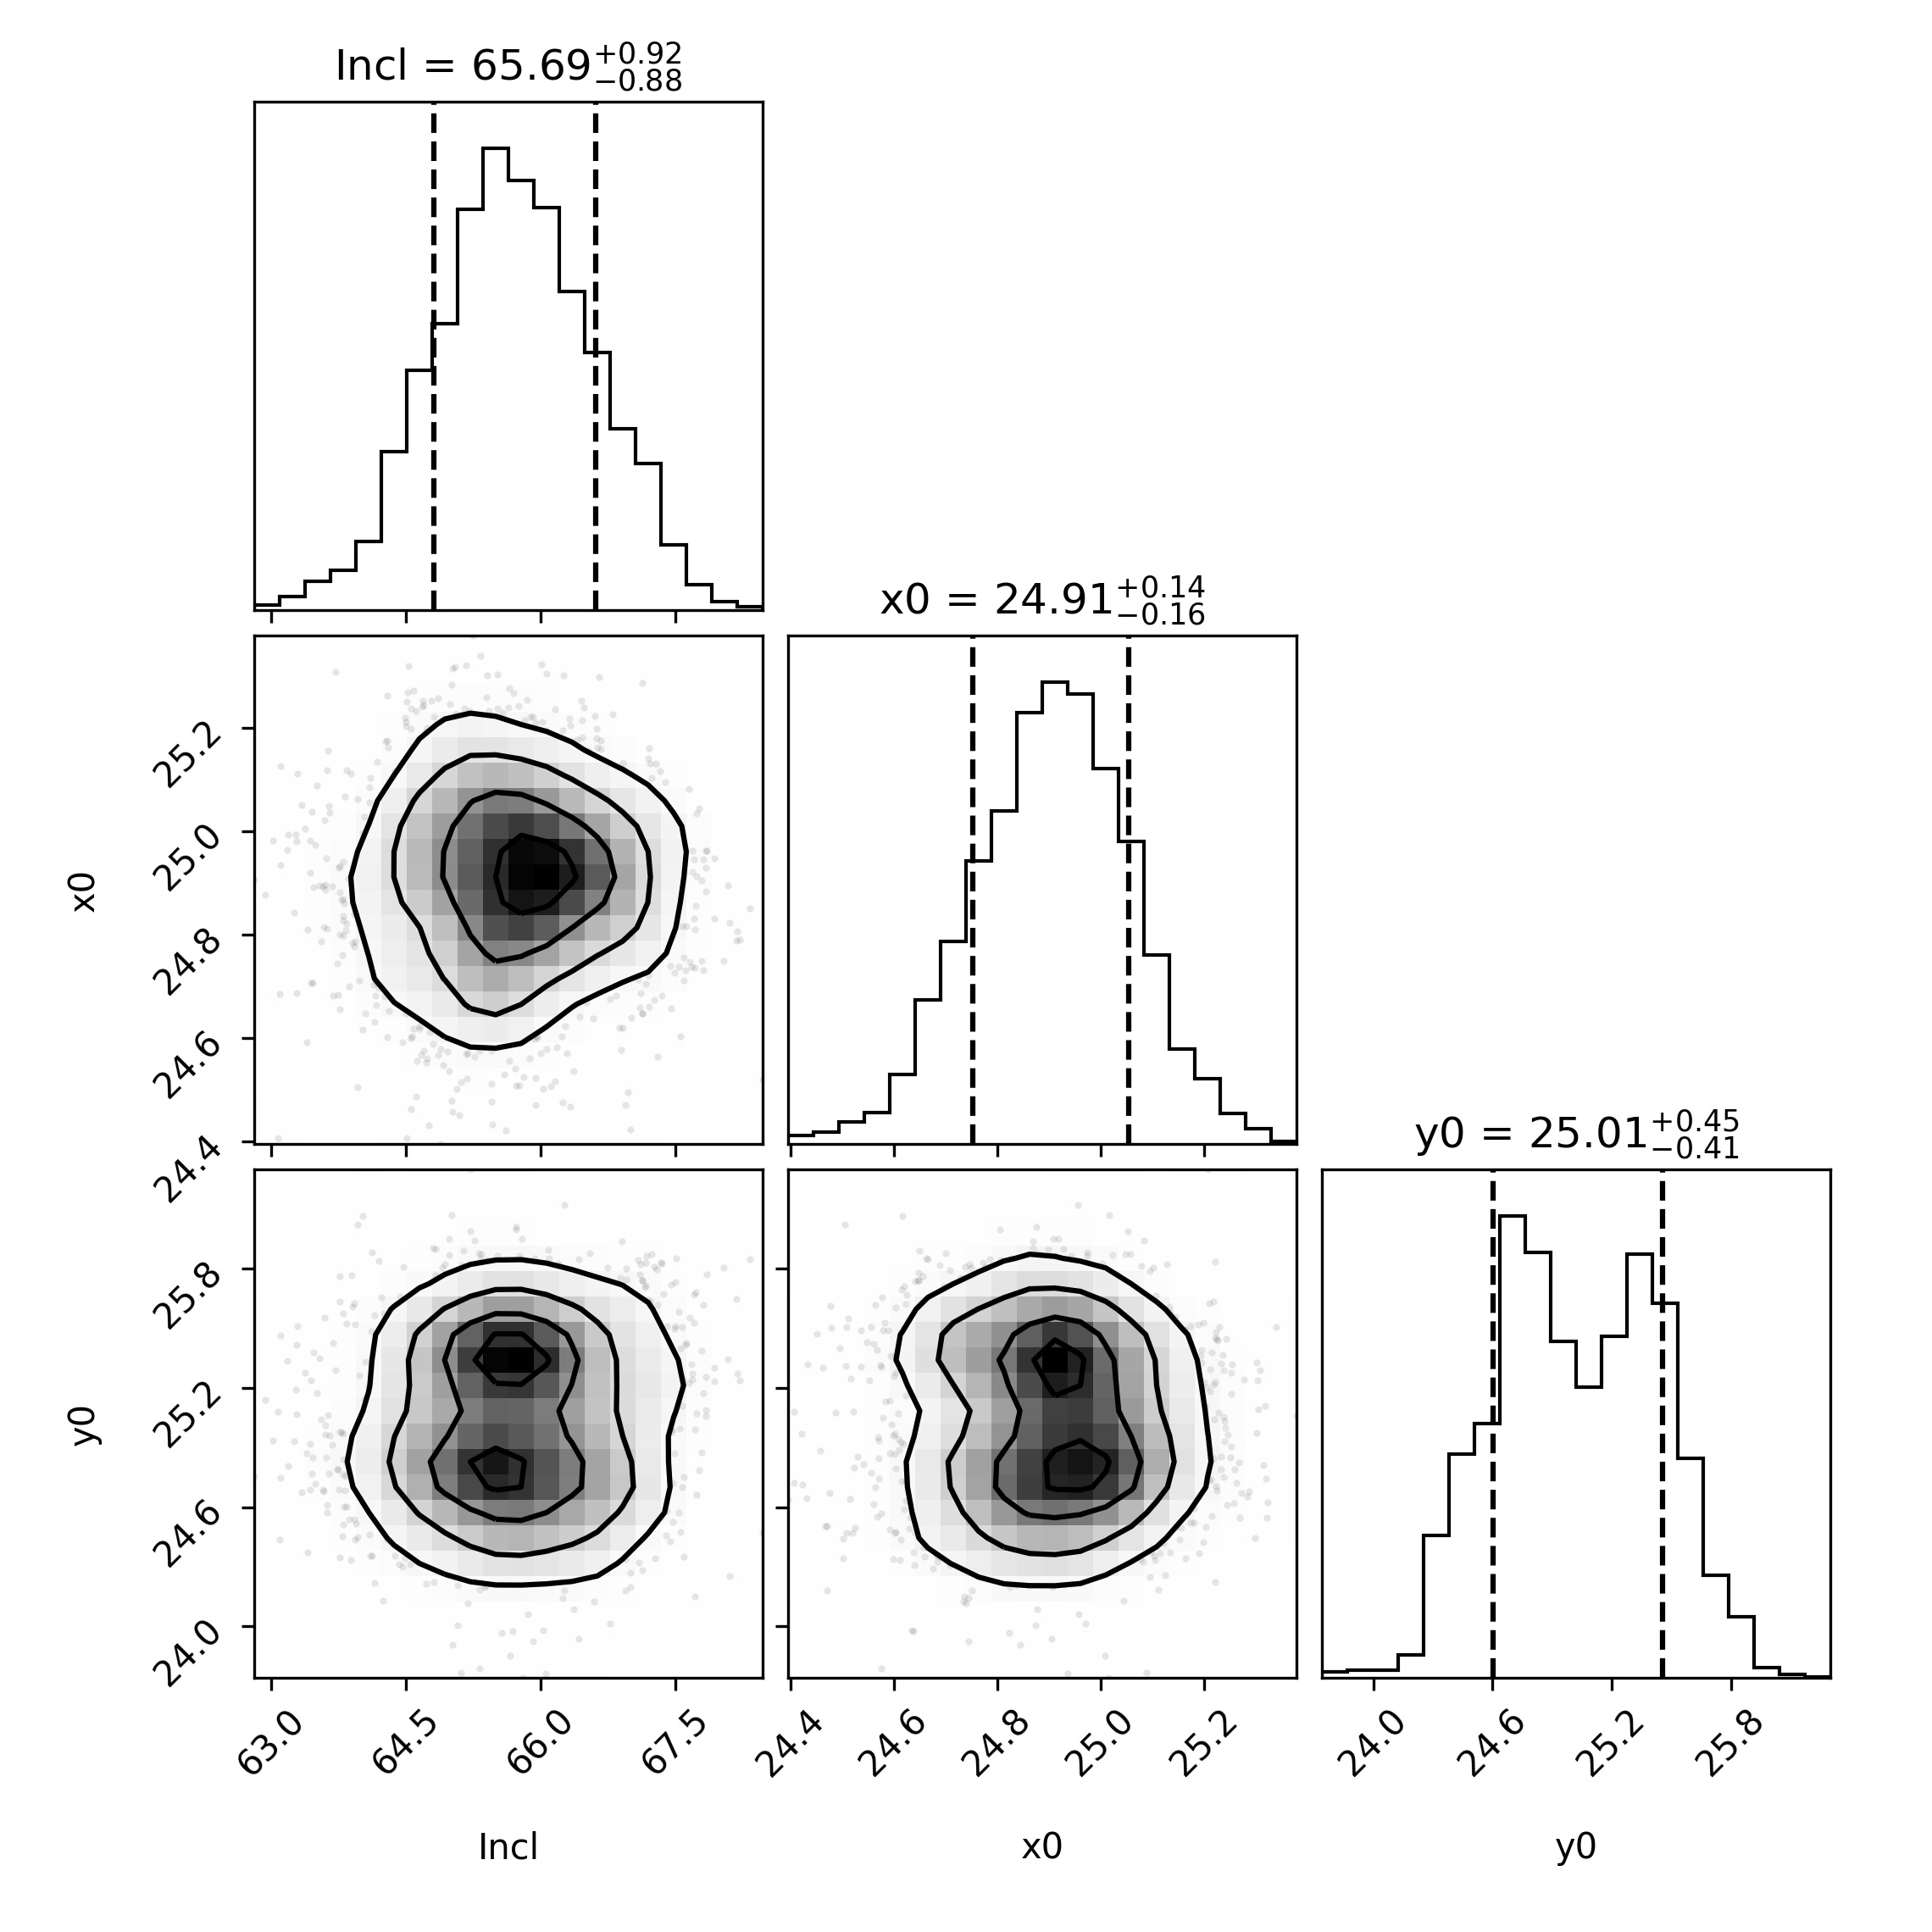
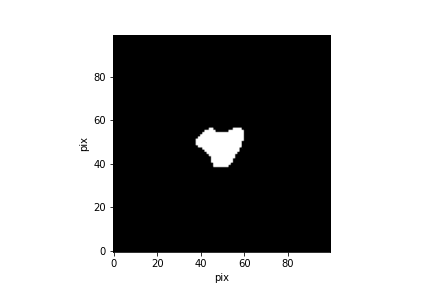
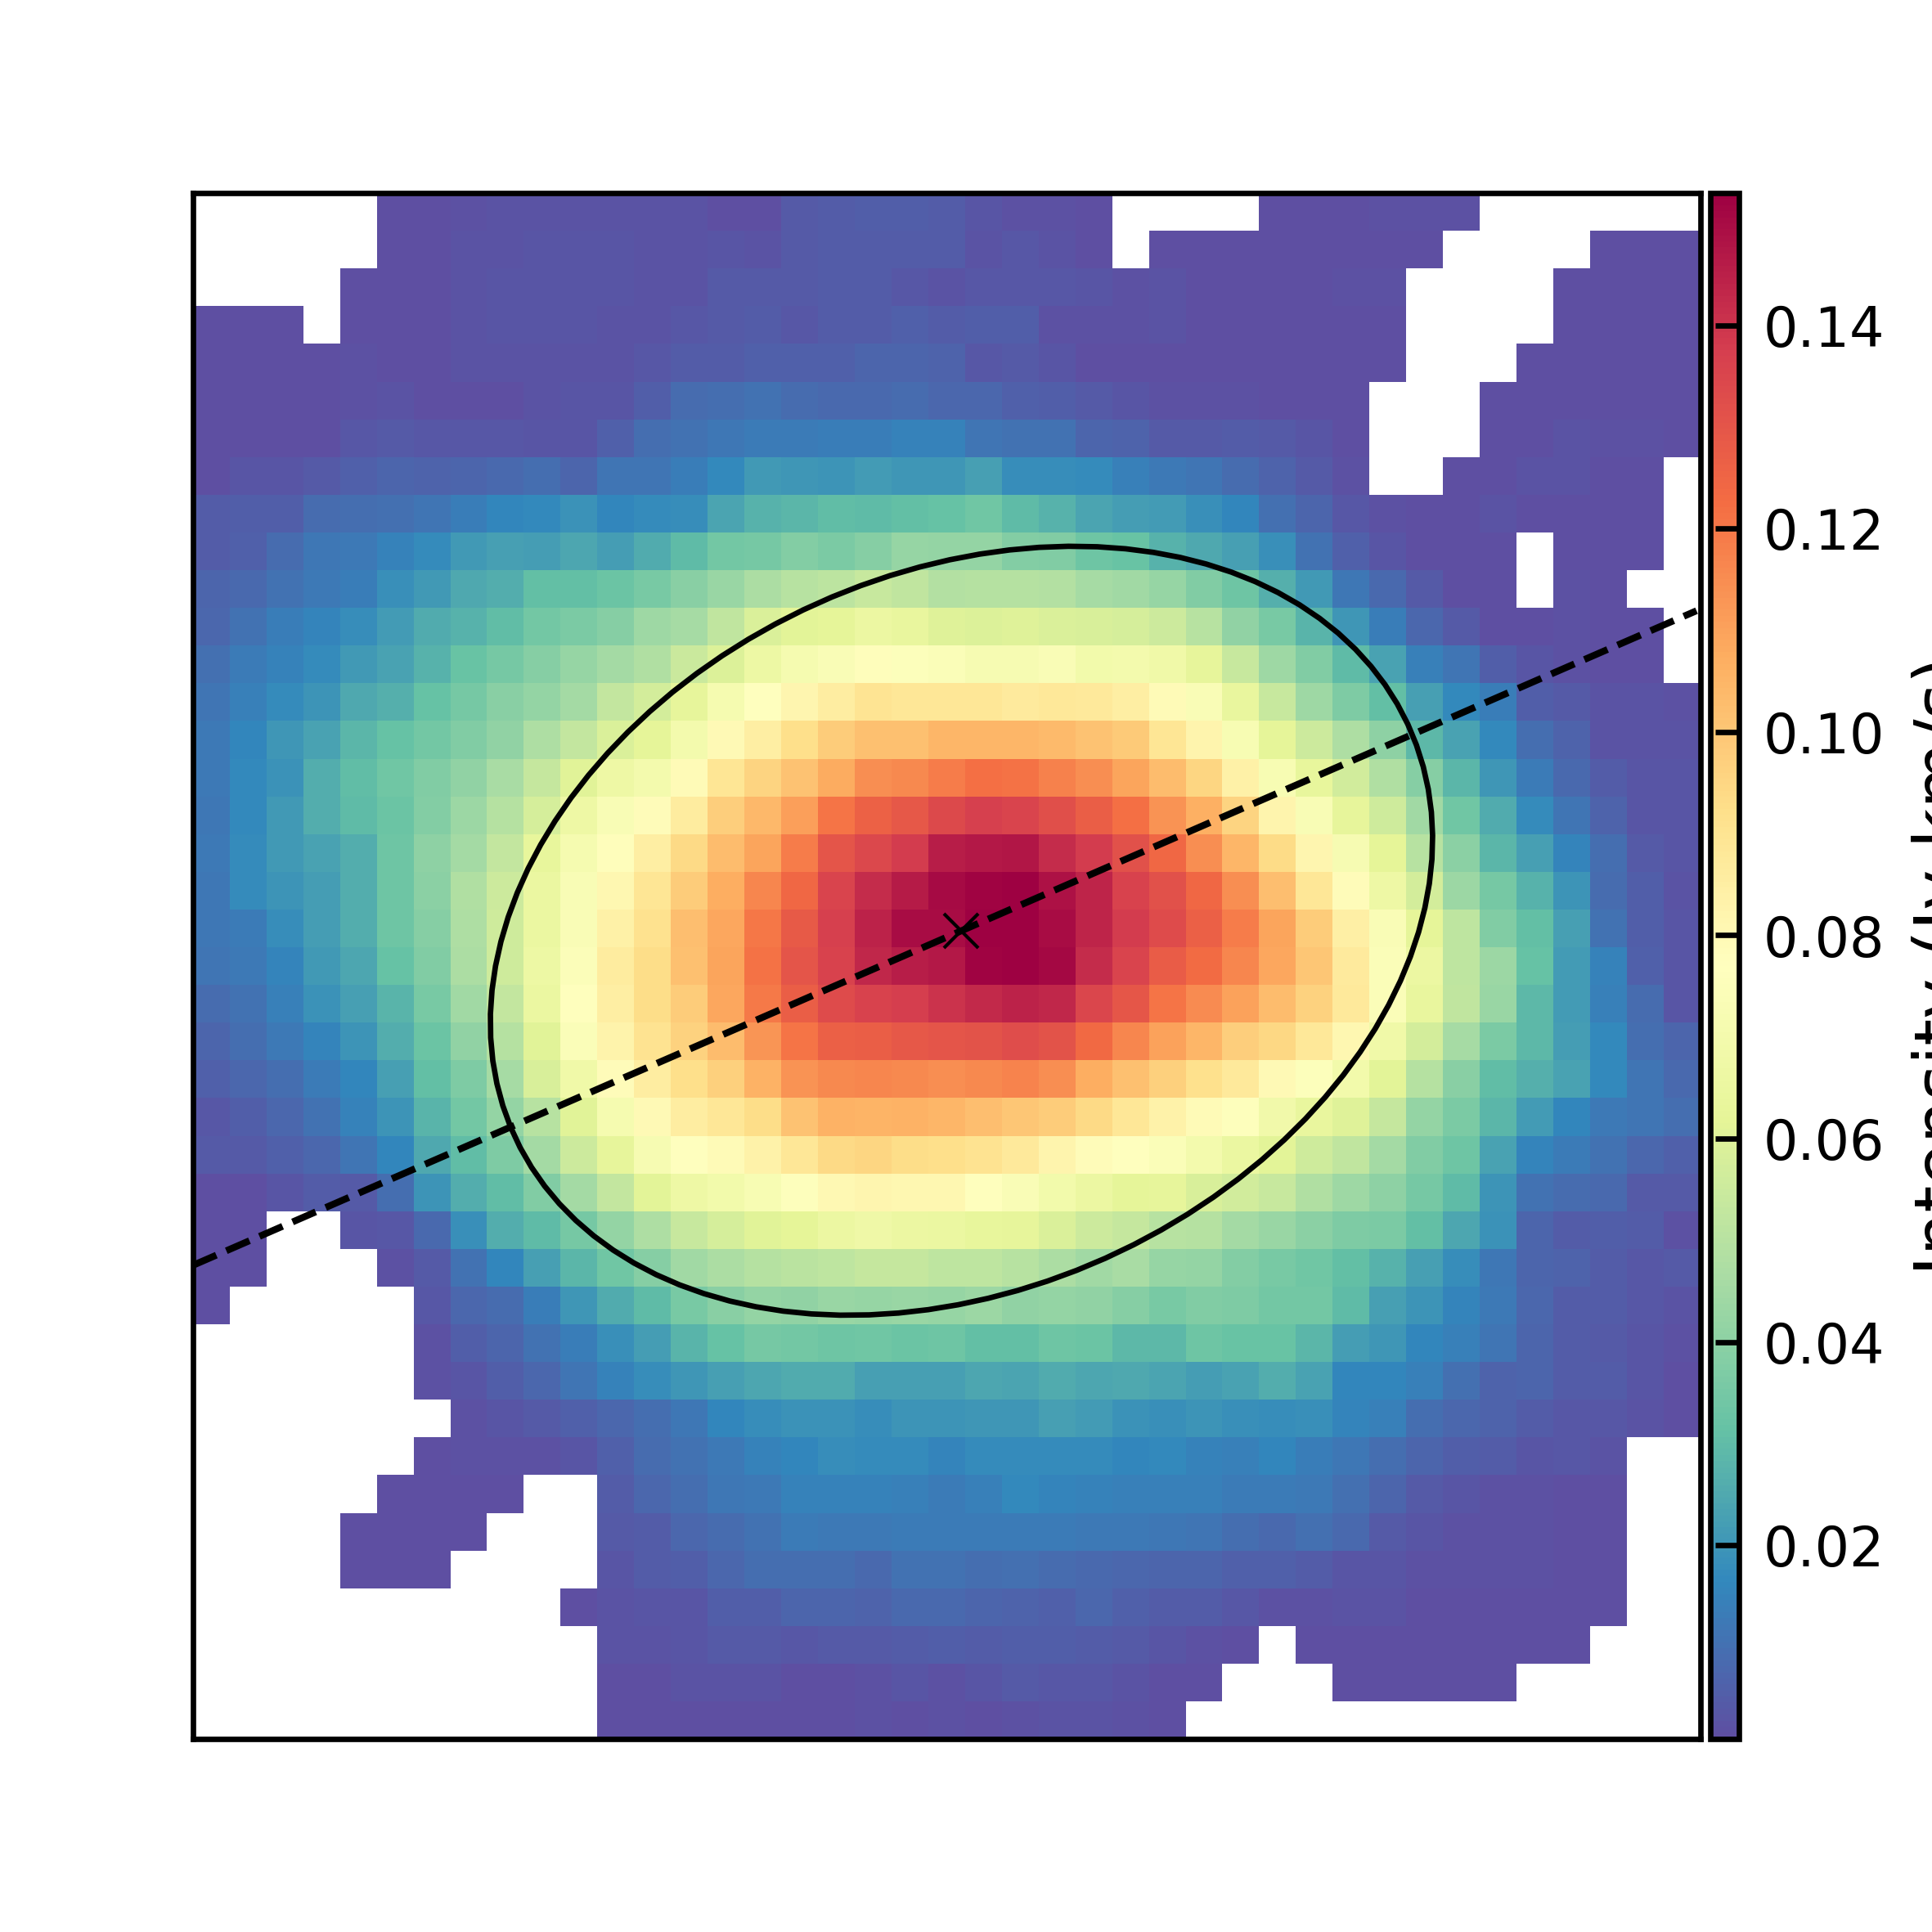
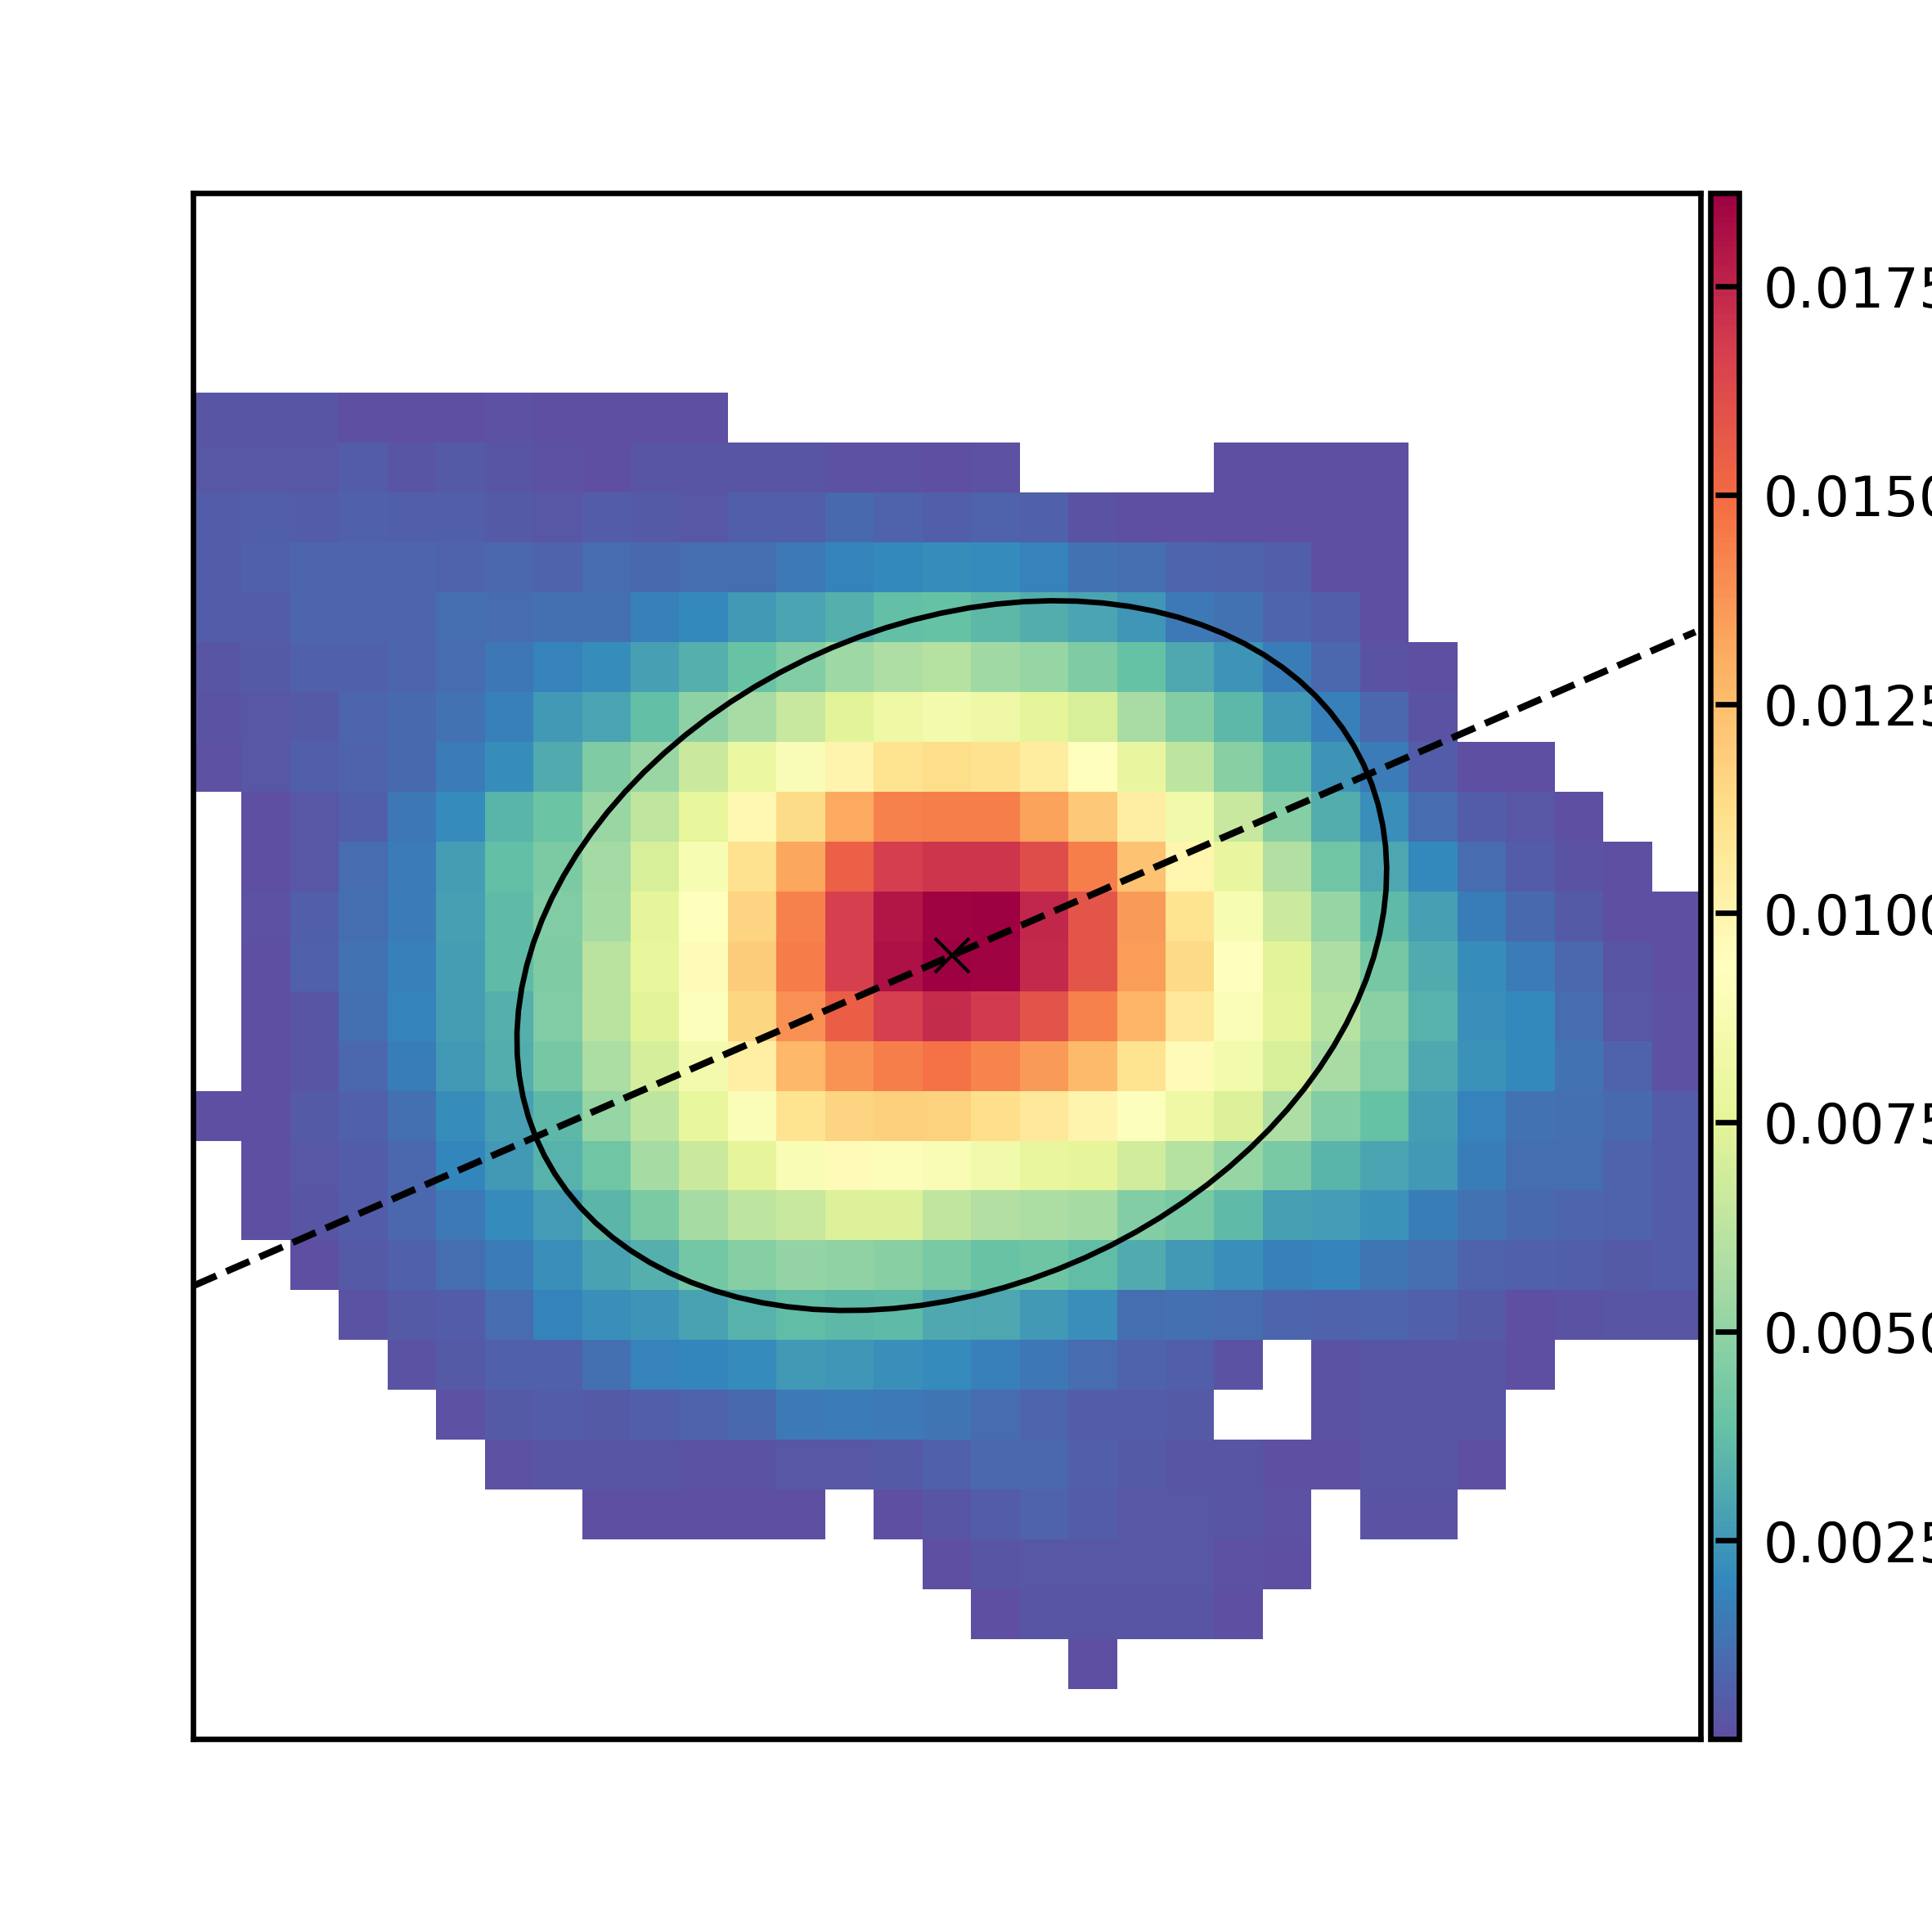
Two artificial galaxies on which BUSSIA was tested immediately before
it was applied to AzTEC-1 are shown in Figure 3. The
galaxy in Figure 1 has an input inclination of \(30\degree\); that in Figure 2 has an inclination of \(66\degree\). In both cases the input value was
recovered within the \(1\sigma\)
uncertainties. We are therefore confident in applying this code to
AzTEC-1.
When exploring the parameter space and performing the MCMC sampling,
we consider only the [CII] emission line, since we expect the same
geometry for both emission lines (Tacconi et al. 2010; Tadaki
et al. 2019). We choose [CII] over CO because of its higher signal-to-noise ratio and greater spatial extent, allowing us to better model the whole disc.
In Chapter 1 we mentioned the presence of a non-corotating clump in
AzTEC-1. Since we wish to understand the geometry of
the gas disc, we run the MCMC fitting on data cubes both with and without the clump included, to see
what effect it has on the fitted inclination.
2.4 Kinematic modelling
We create kinematic models with \(^\textit{3D}\)BAROLO using a parameter file
that contains values for the main geometric parameters obtained as
described above, together with initial guesses for the fit. All models of both
tracers use a scale height of zero, since any realistic disc
thickness is negligible compared with the beam of the
observations.
The \(^\textit{3D}\)BAROLO parameter
SEARCH initialises a source-detection algorithm to find the galaxy in
the data cube. One output of SEARCH is a mask
cube that matches the emission cube being modelled in all
dimensions and contains values of 0
and 1. Pixels with value 1 mark regions where galaxy emission
is present; pixels outside these regions are set to 0. Only data
inside the mask are used in the fit. Some experimentation
with mask parameters was required to find suitable values.
Our final mask was created using the SMOOTH&SEARCH algorithm, which
first smooths the data cube spatially by a factor of 1.4 for [CII] and 1.6
for CO and then performs a three-dimensional source detection
governed by two further parameters: SNRCUT, the
primary signal-to-noise cut, and GROWTHCUT, the secondary signal-to-noise
cut used to grow the detected object. The SMOOTH step convolves each
channel with the elliptical Gaussian defined by the beam major and
minor axes (see Table 1). More
information on these parameters can be found in the \(^\textit{3D}\)BAROLO documentation5. The final values of the mask
parameters are found in Table 2.
| Parameter Values | ||
| [CII] | CO | |
| MASK | SMOOTH&SEARCH | SMOOTH&SEARCH |
| FACTOR | 1.4 | 1.6 |
| SNRCUT \([\sigma]\) | 3.0 | 3.0 |
| GROWTHCUT \([\sigma]\) | 2.25 | 2.6 |
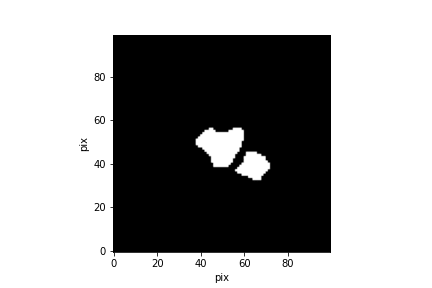
The source-detection algorithm produced masks that included the clump; these were used for the models that retain the clump in both tracers. For models that exclude the clump, the mask was modified to set to zero the spaxels corresponding to regions in the data cube where the clump emission is present.
We did this by inspecting the mask FITS files in SAOImageDS96, where custom regions can be defined
around the desired areas (Joye and Mandel 2003). These
are exported as .reg files. The regions and mask FITS files were
combined using the programme MKMASK7, which
subtracts 1 from every pixel in the region. Some areas of the mask therefore became -1, and PYTHON was then used to set any
negative pixel values to 0. A visualisation of the mask editing is shown
in Figure 6.
\(^\textit{3D}\)BAROLO offers two methods for normalising the surface brightness. Normalisation allows \(^\textit{3D}\)BAROLO to exclude the surface brightness of the gas from the fit (Di Teodoro and Fraternali 2015). The LOCAL option is a pixel-by-pixel normalisation that requires each model spatial pixel integrated along the spectral axis to equal the corresponding integrated spatial pixel in the data. The second option, AZIM, uses the azimuthally averaged flux in each ring. We adopt the LOCAL option throughout this thesis.
We use the parameter values determined from inspection and fitting to produce a fiducial model that leaves only the rotational velocity and velocity dispersion free for \(^\textit{3D}\)BAROLO to fit. Starting from the fiducial model we then investigate radial motions using two different initial guesses for the radial velocity, in order to explore whether there are any radial motions across the disc. Comparing these models in both tracers, with and without the clump, provides the information required to characterise the kinematics of the galaxy and to determine the impact of the non-corotating clump.
3 Results & Discussion
In this chapter we present the results of our investigation into AzTEC-1’s redshift and inclination angle, as well as its characteristic kinematic properties, in particular its rotation velocity, gas velocity dispersion and radial motions.
3.1 Redshift
The average systemic redshift derived from the two emission lines is \(z_{sys} = 4.3418_{-0.0005}^{+0.0005}\), in agreement with the previous value of \(z=4.342\) (Tadaki et al. 2019). The systemic frequencies fitted by \(^\textit{3D}\)BAROLO for the [CII] and CO lines and the corresponding redshifts are listed in Table 3.
| \(\mathbf{\nu_{sys}}\) [MHz] | \(\mathbf{z_{sys}}\) | |
|---|---|---|
| \(355775.3_{-5.4}^{+5.5}\) | \(4.3420_{-0.0004}^{+0.0004}\) | |
| CO | \(86312.1_{-6.3}^{+5.7}\) | \(4.3415_{-0.0009}^{+0.0008}\) |
| Avg.: | \(4.3418_{-0.0005}^{+0.0005}\) | |
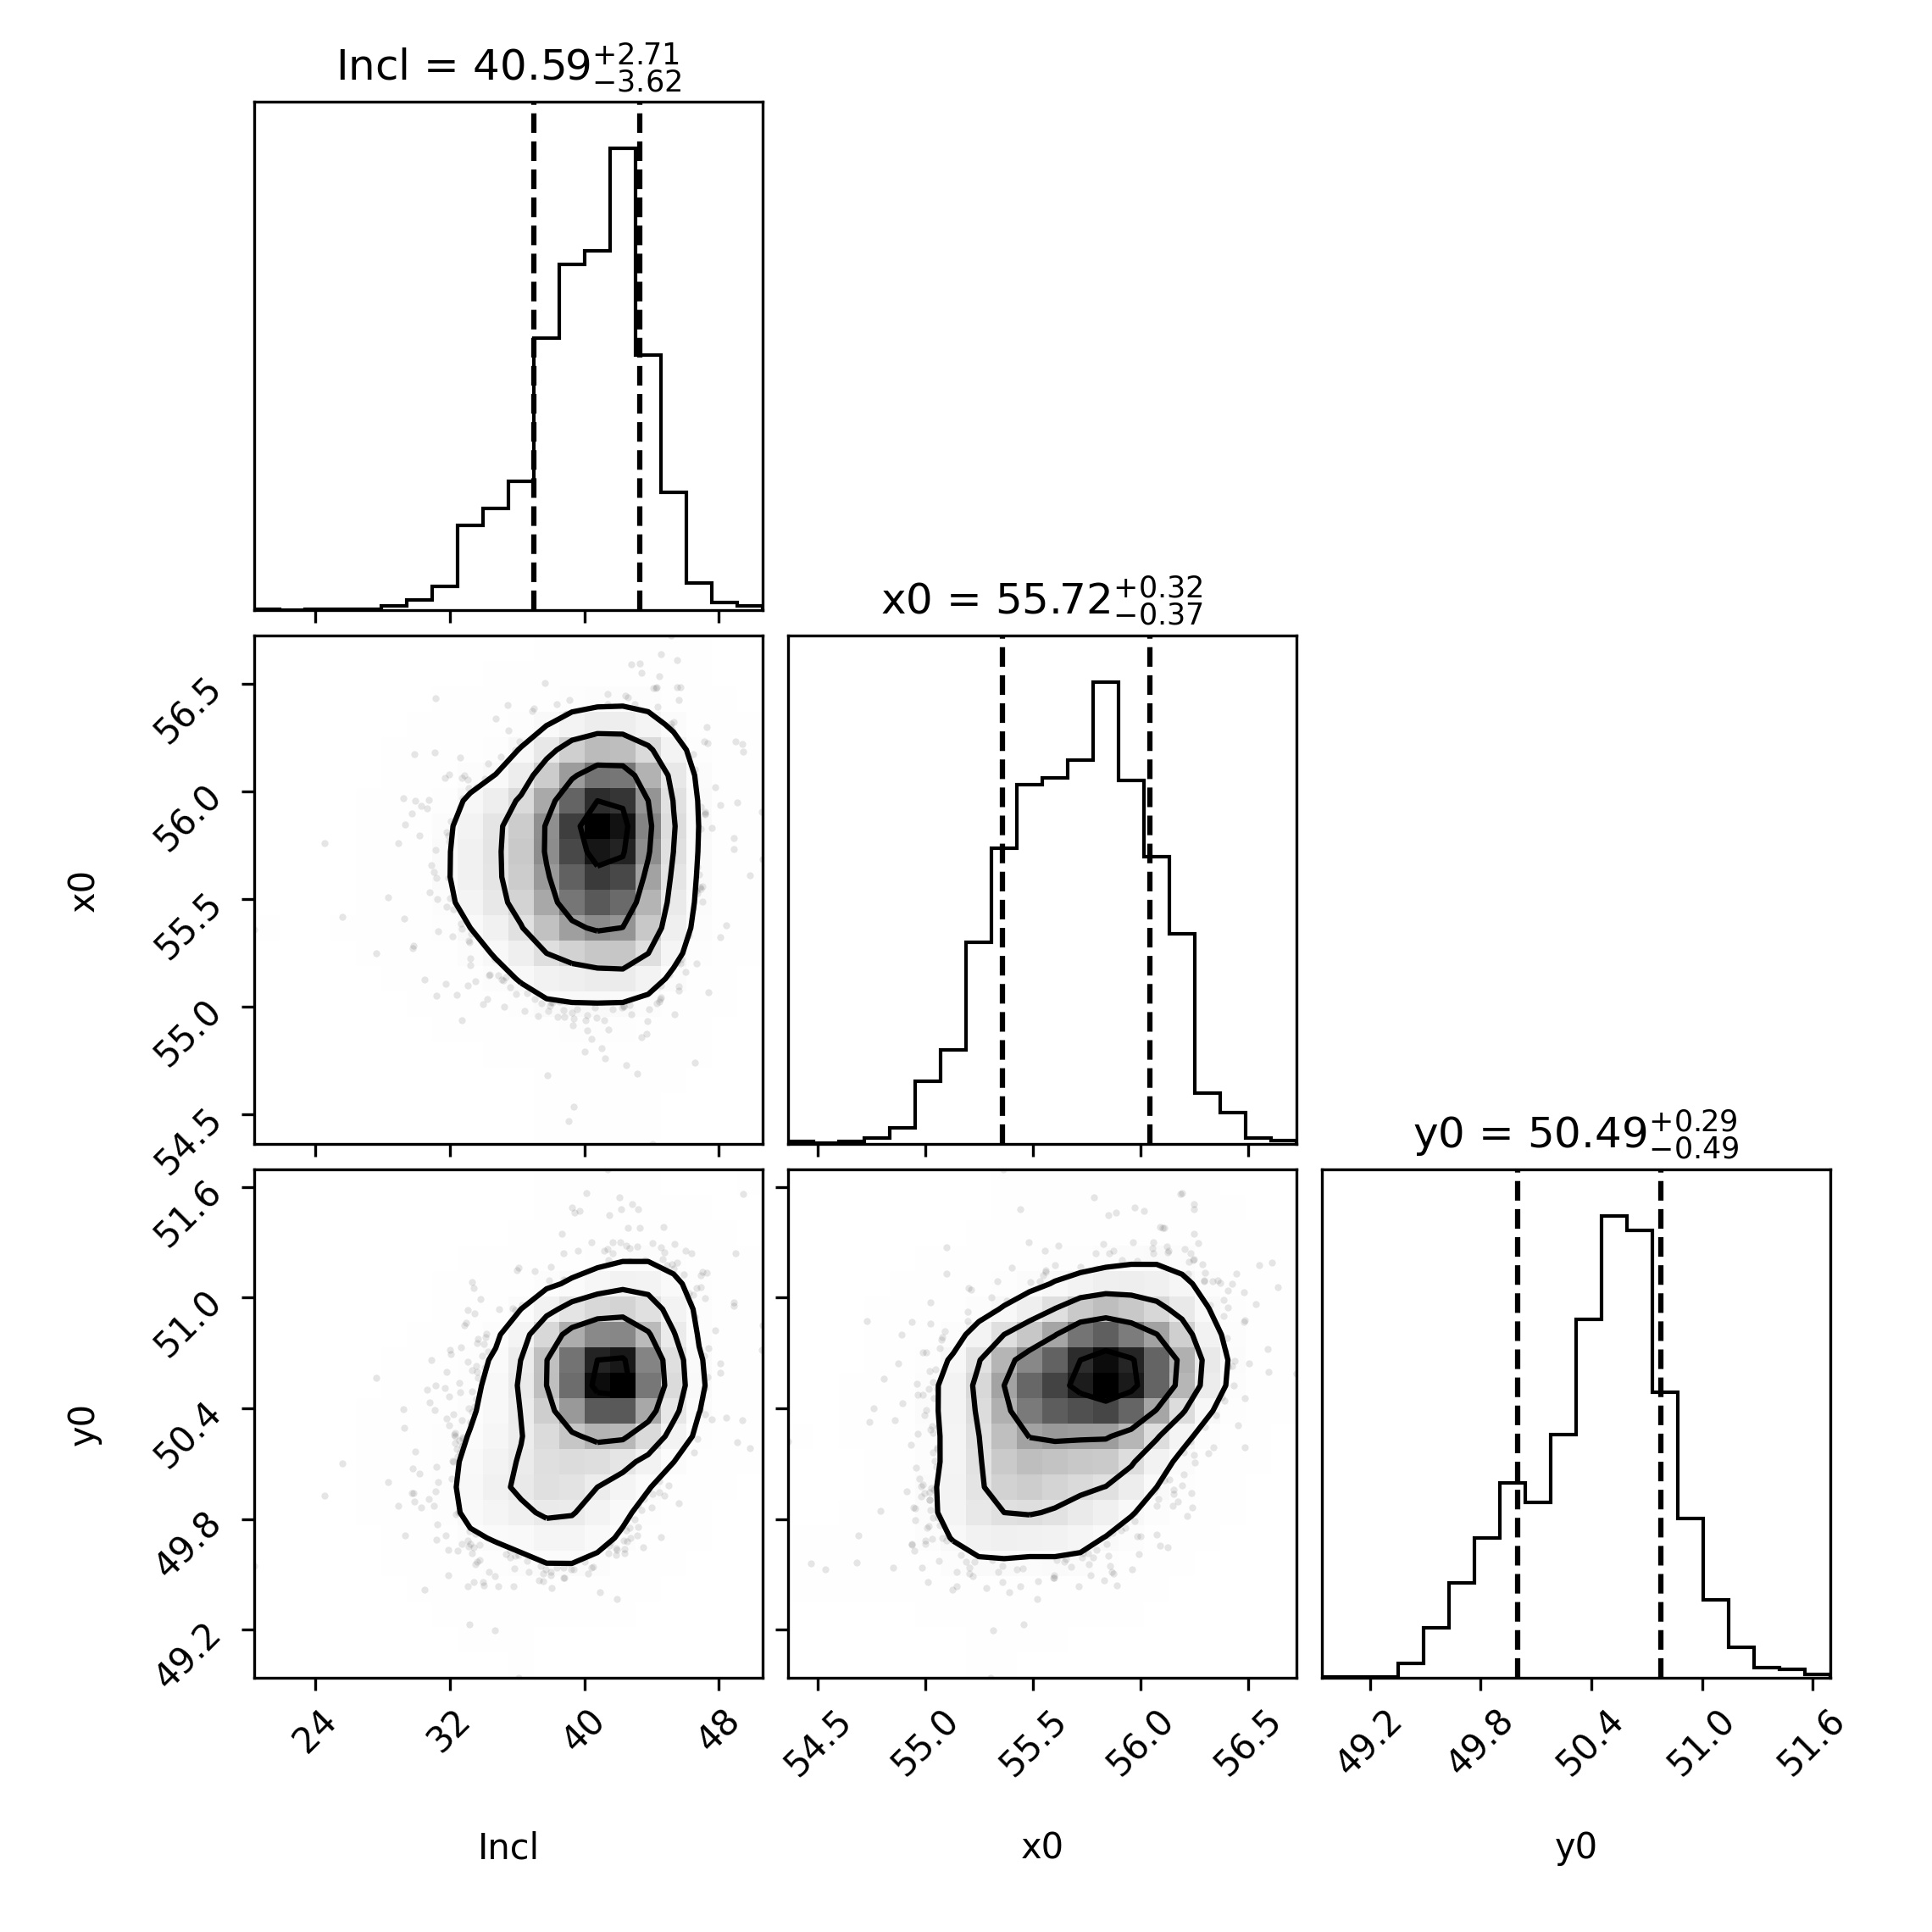
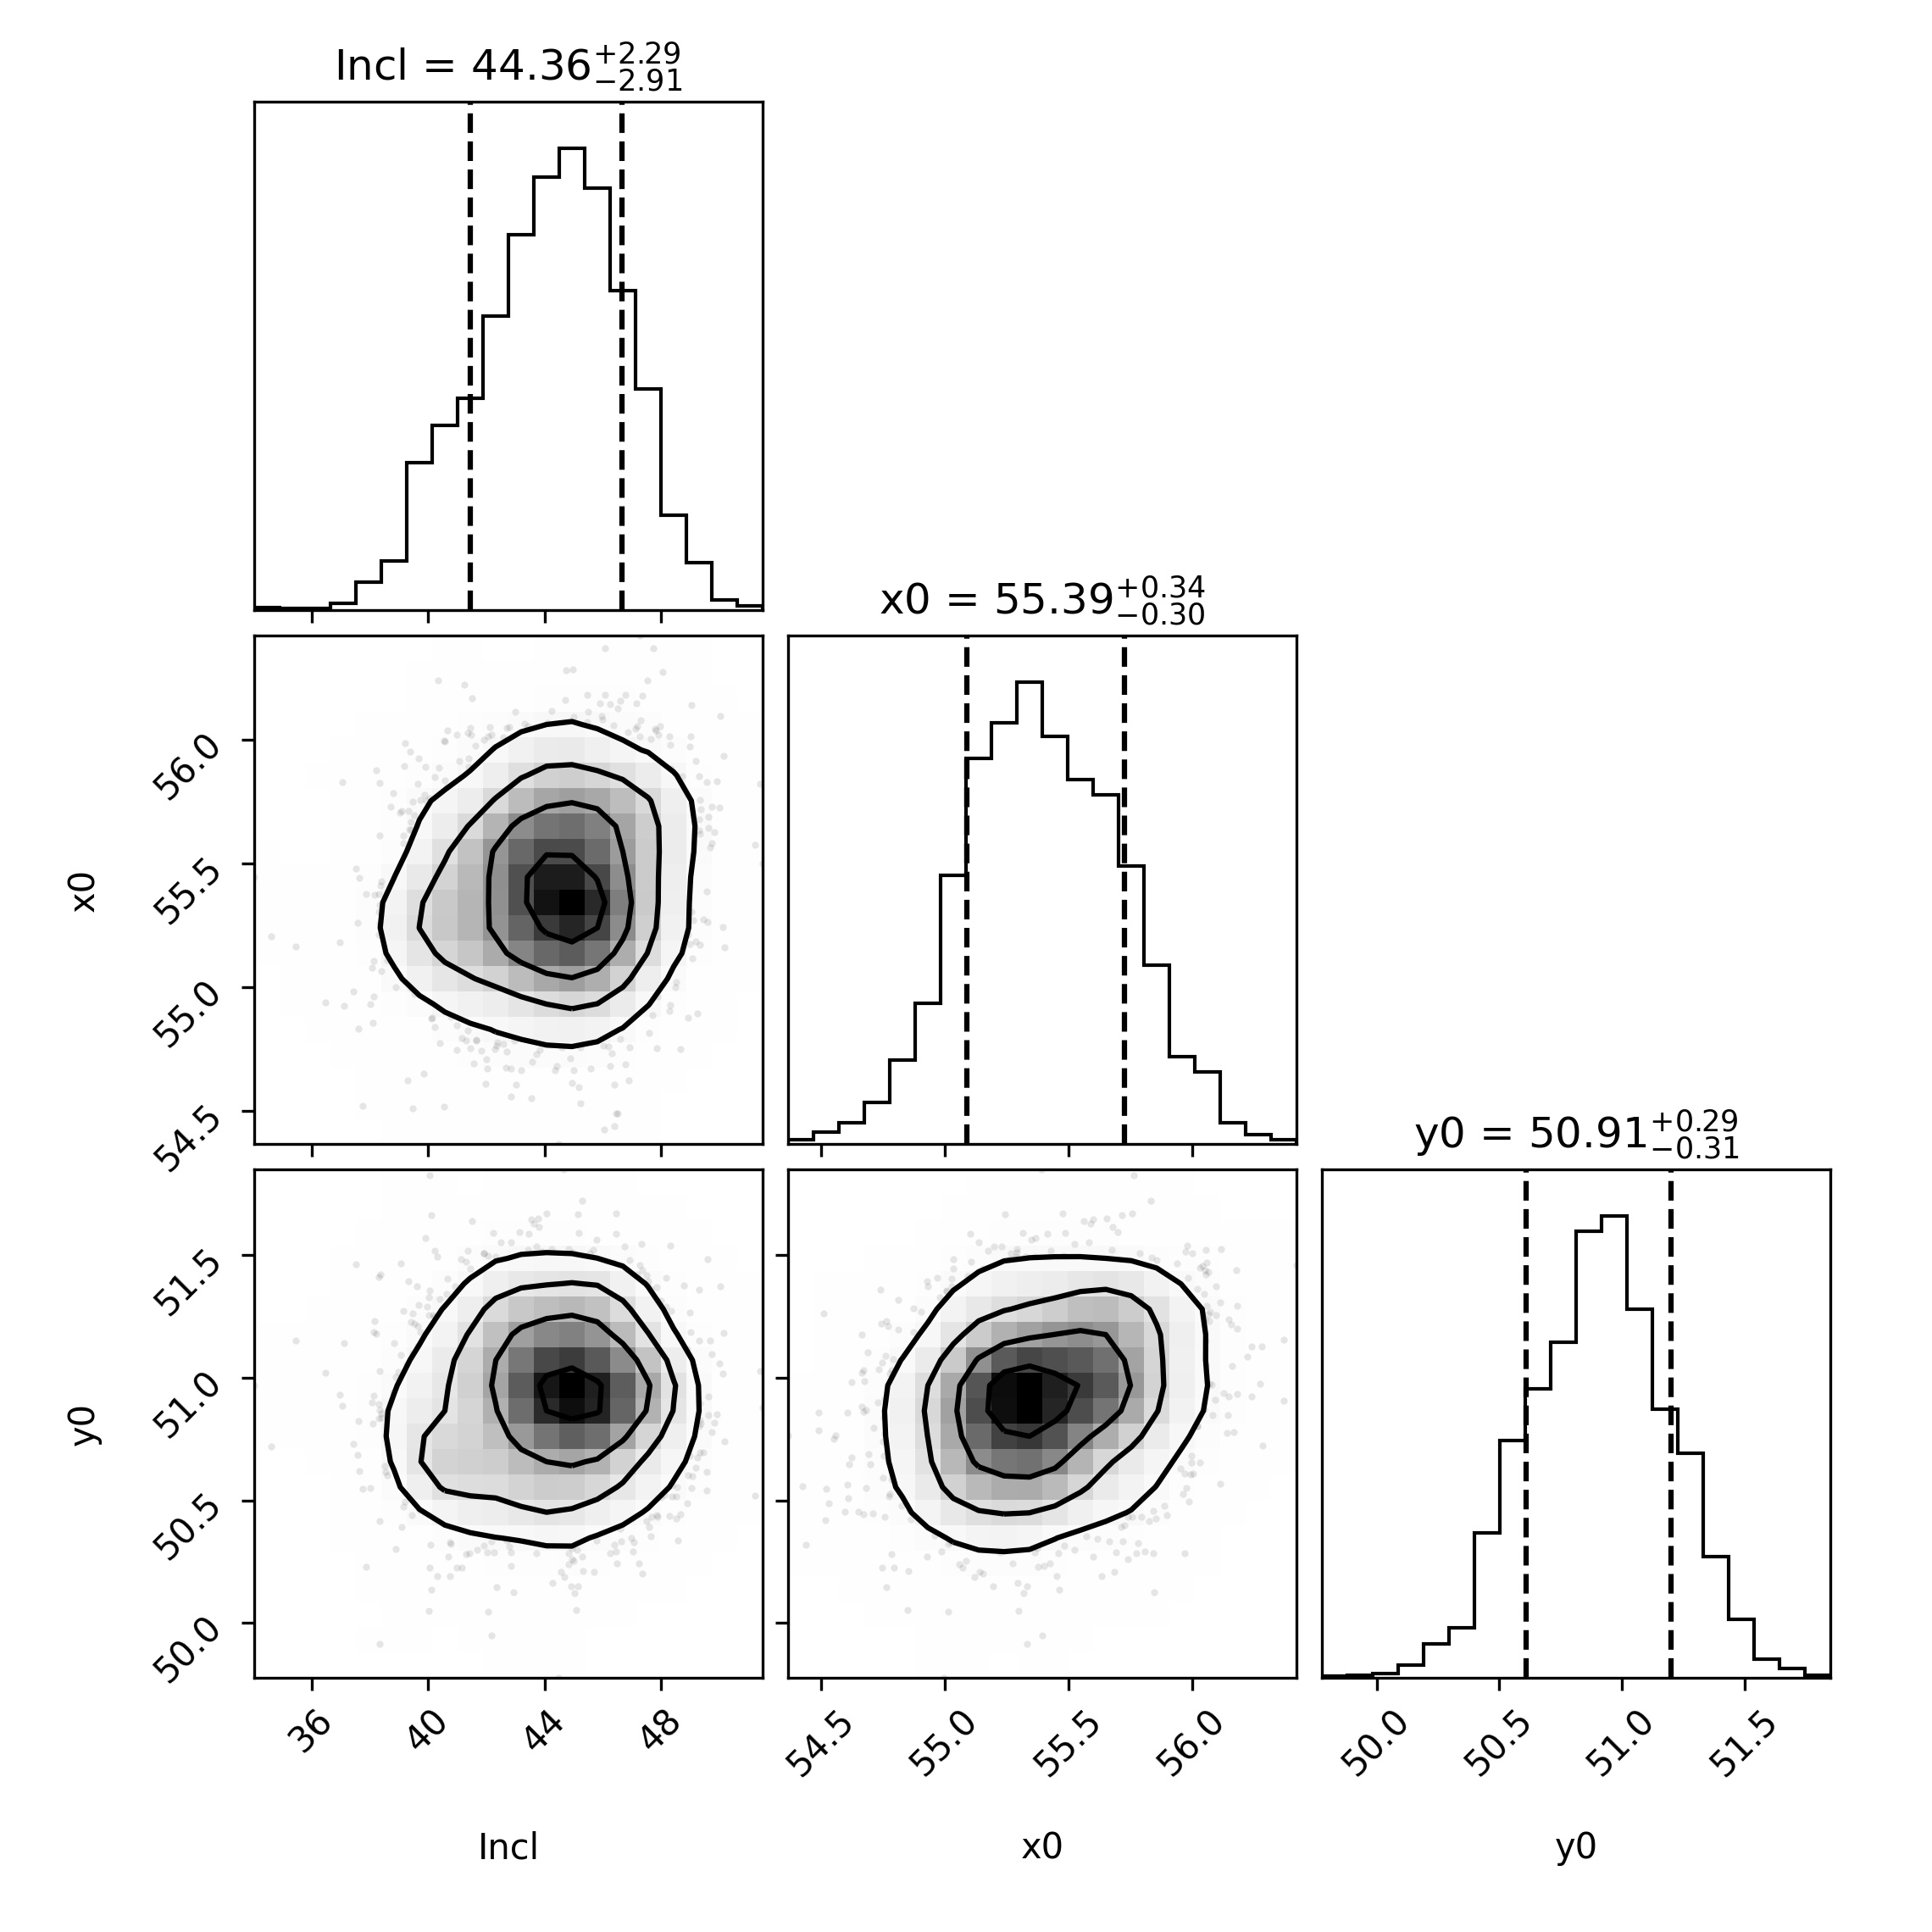
3.2 Inclination
Figure Fig. 6 shows the posterior distributions from the MCMC fits for the inclination and centre of AzTEC-1 obtained with the BUSSIA code (see Chapter 2.3). The fitted parameter values are listed in Table 4. We carried out two fits, one including and one excluding the non-corotating clump; both required approximately 2,500 iterations to reach convergence. Including or excluding the clump changes the inclination angle by \(\sim4\degree\) and the centre by no more than \(\sim0.5\) px. The two inclination values are compatible at the \(1\sigma\) level (see Table 4). The result excluding the non-corotating clump agrees within the uncertainties with the value of \(44\degree\pm1\degree\) found in a previous study of AzTEC-1 (Tadaki et al. 2018). That value was obtained from the best-fit parameters of GalPaK\(^\textit{3D}\), using an MCMC chain of 20,000 iterations for a symmetric disc model with ten free parameters.
We trust the BUSSIA result given its success on the two mock galaxies, where it recovered the input inclinations within \(1\sigma\). Since we are studying the kinematic properties of the disc, of which the non-corotating component is clearly not part, we adopt the geometry from the model excluding the clump. The inclination value \(44.36\degree_{-2.91}^{+2.29}\) is used for all kinematic models produced.
| \(\mathbf{x_0}\) [pix] | \(\mathbf{y_0}\) [pix] | Inclination \(\mathbf{[ \degree ]}\) | |
|---|---|---|---|
| Including Clump | \(55.72_{-0.37}^{+0.32}\) | \(50.49_{-0.49}^{+0.29}\) | \(40.59_{-3.62}^{+2.71}\) |
| Excluding Clump | \(55.39_{-0.30}^{+0.34}\) | \(50.91_{-0.31}^{+0.29}\) | \(44.36_{-2.91}^{+2.29}\) |
3.3 Fiducial models
In this section we present the kinematic models produced by \(^\textit{3D}\)BAROLO. We first fit for the rotation velocity and velocity dispersion in each ring. We treat these models as fiducial, against which all other models are compared, since rotation and dispersion are the most fundamental kinematic quantities of the galaxy’s gas disc.
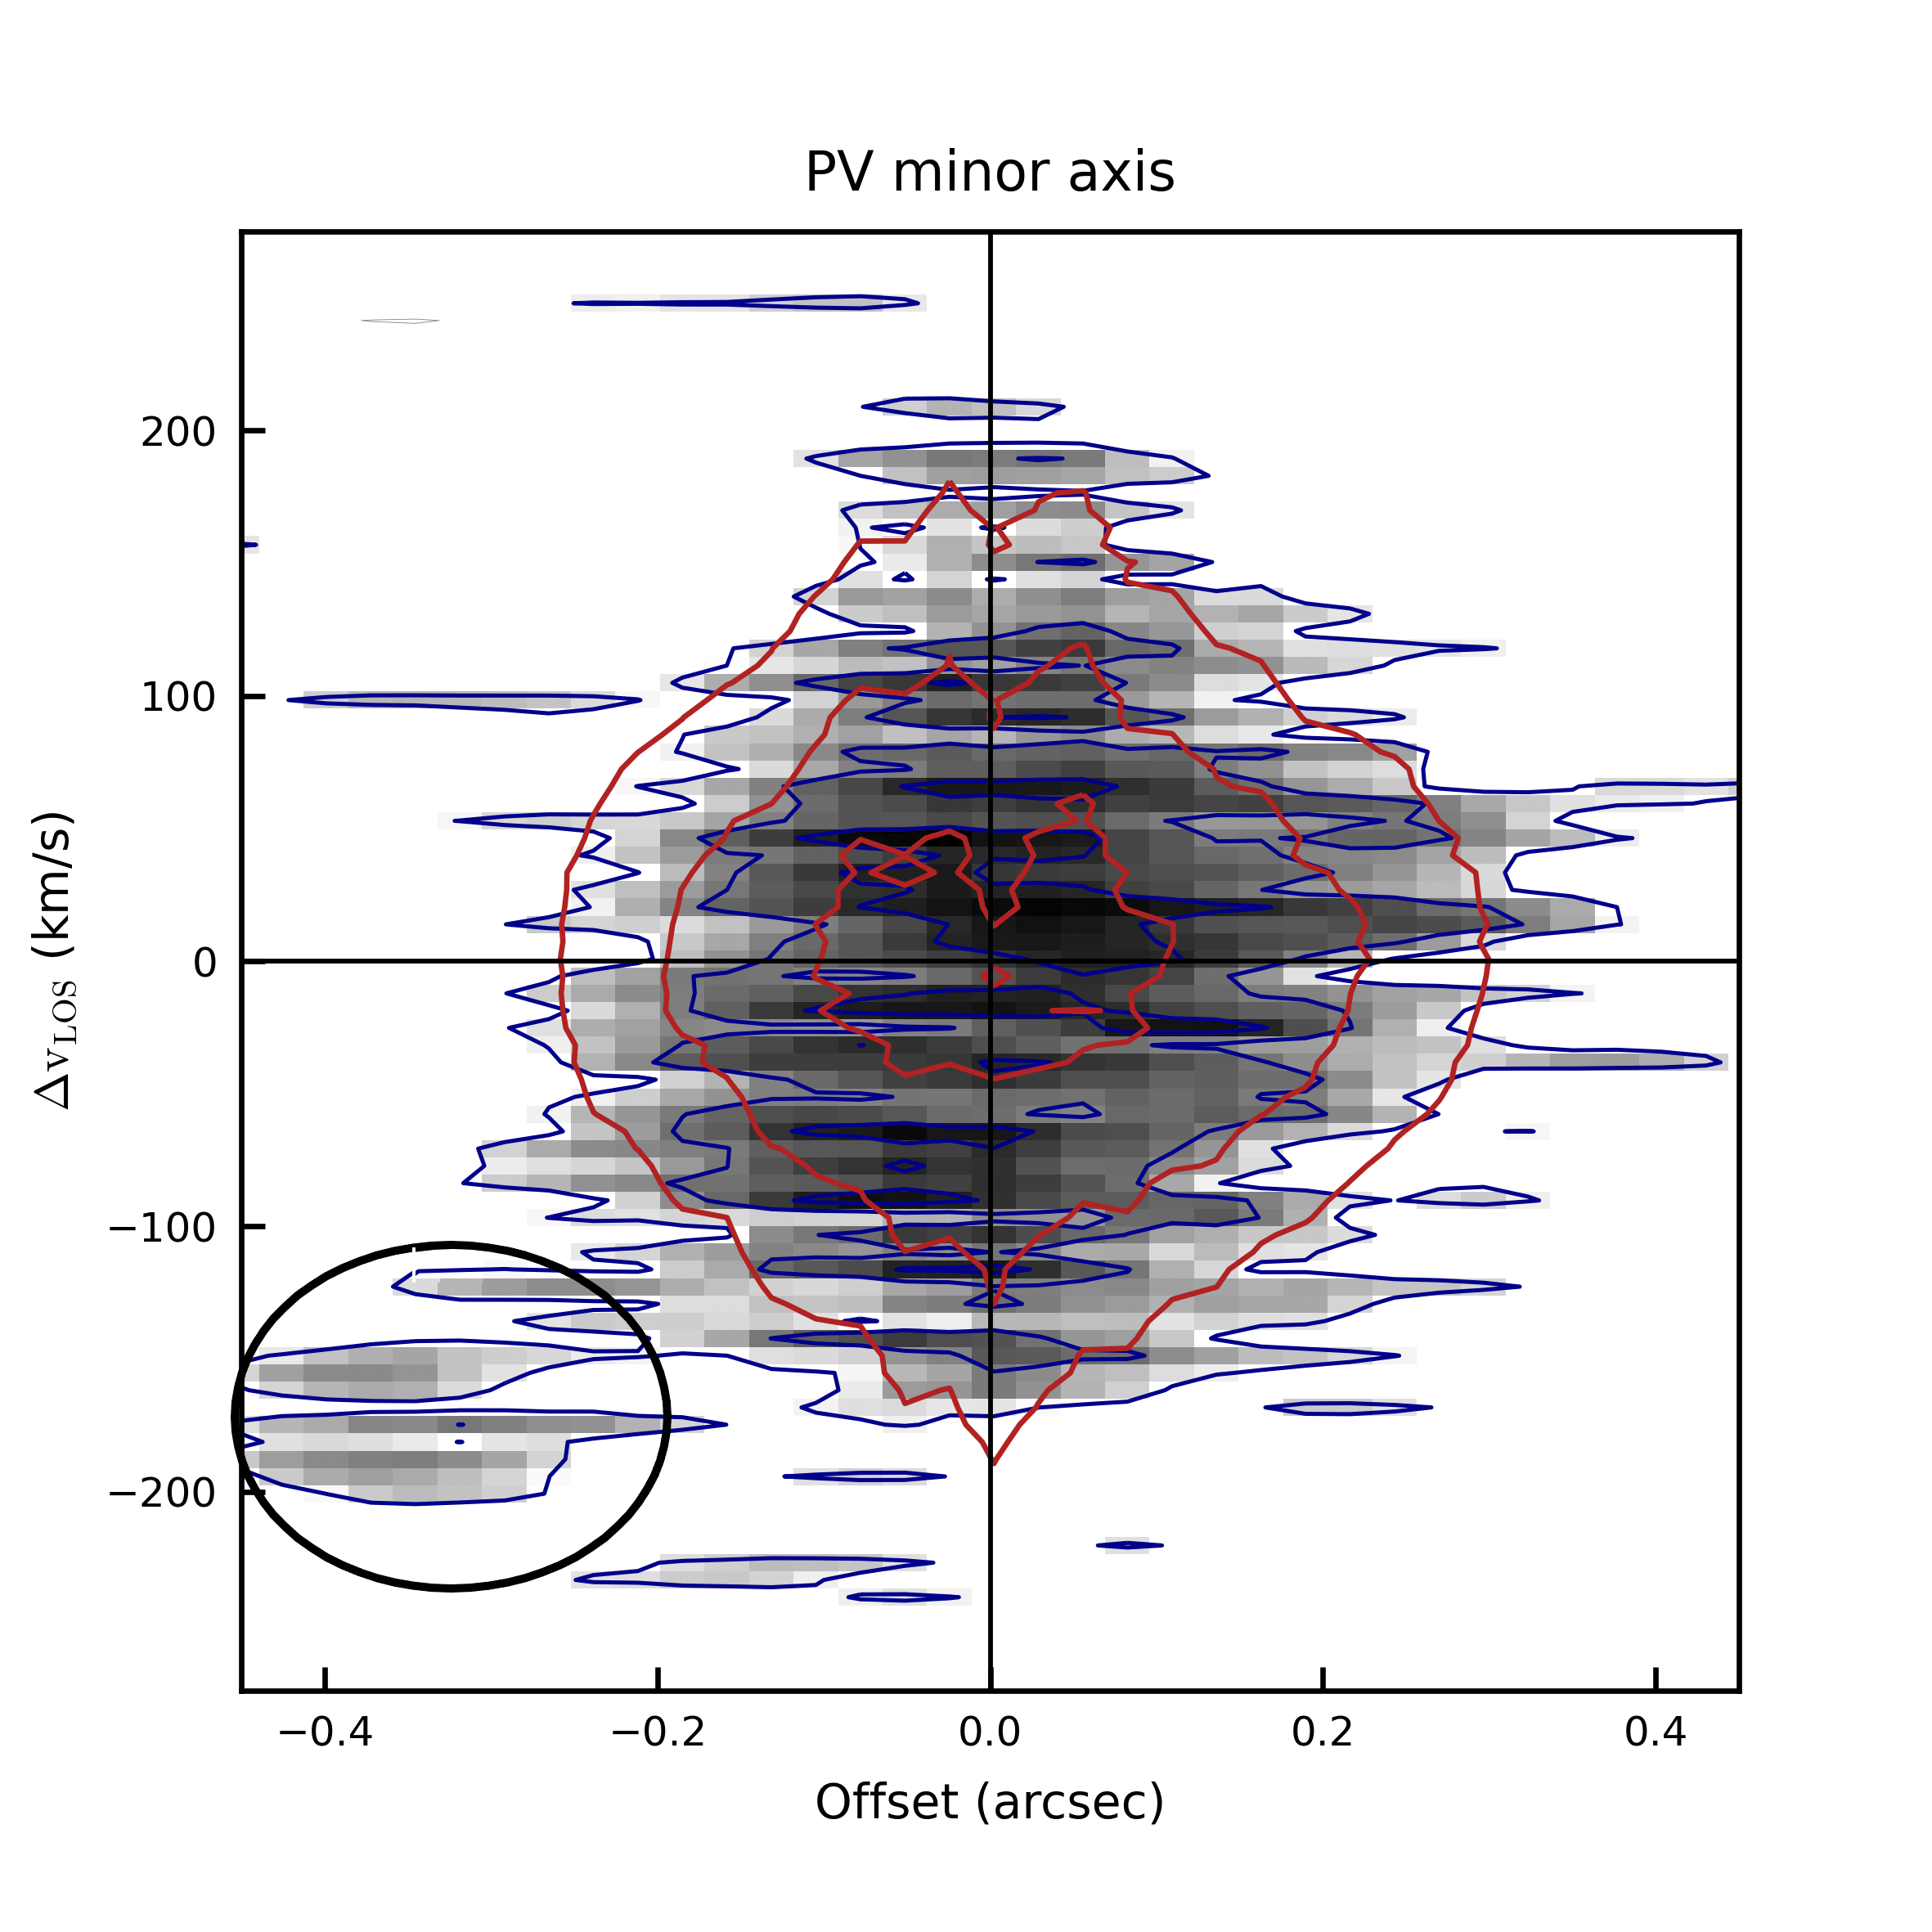
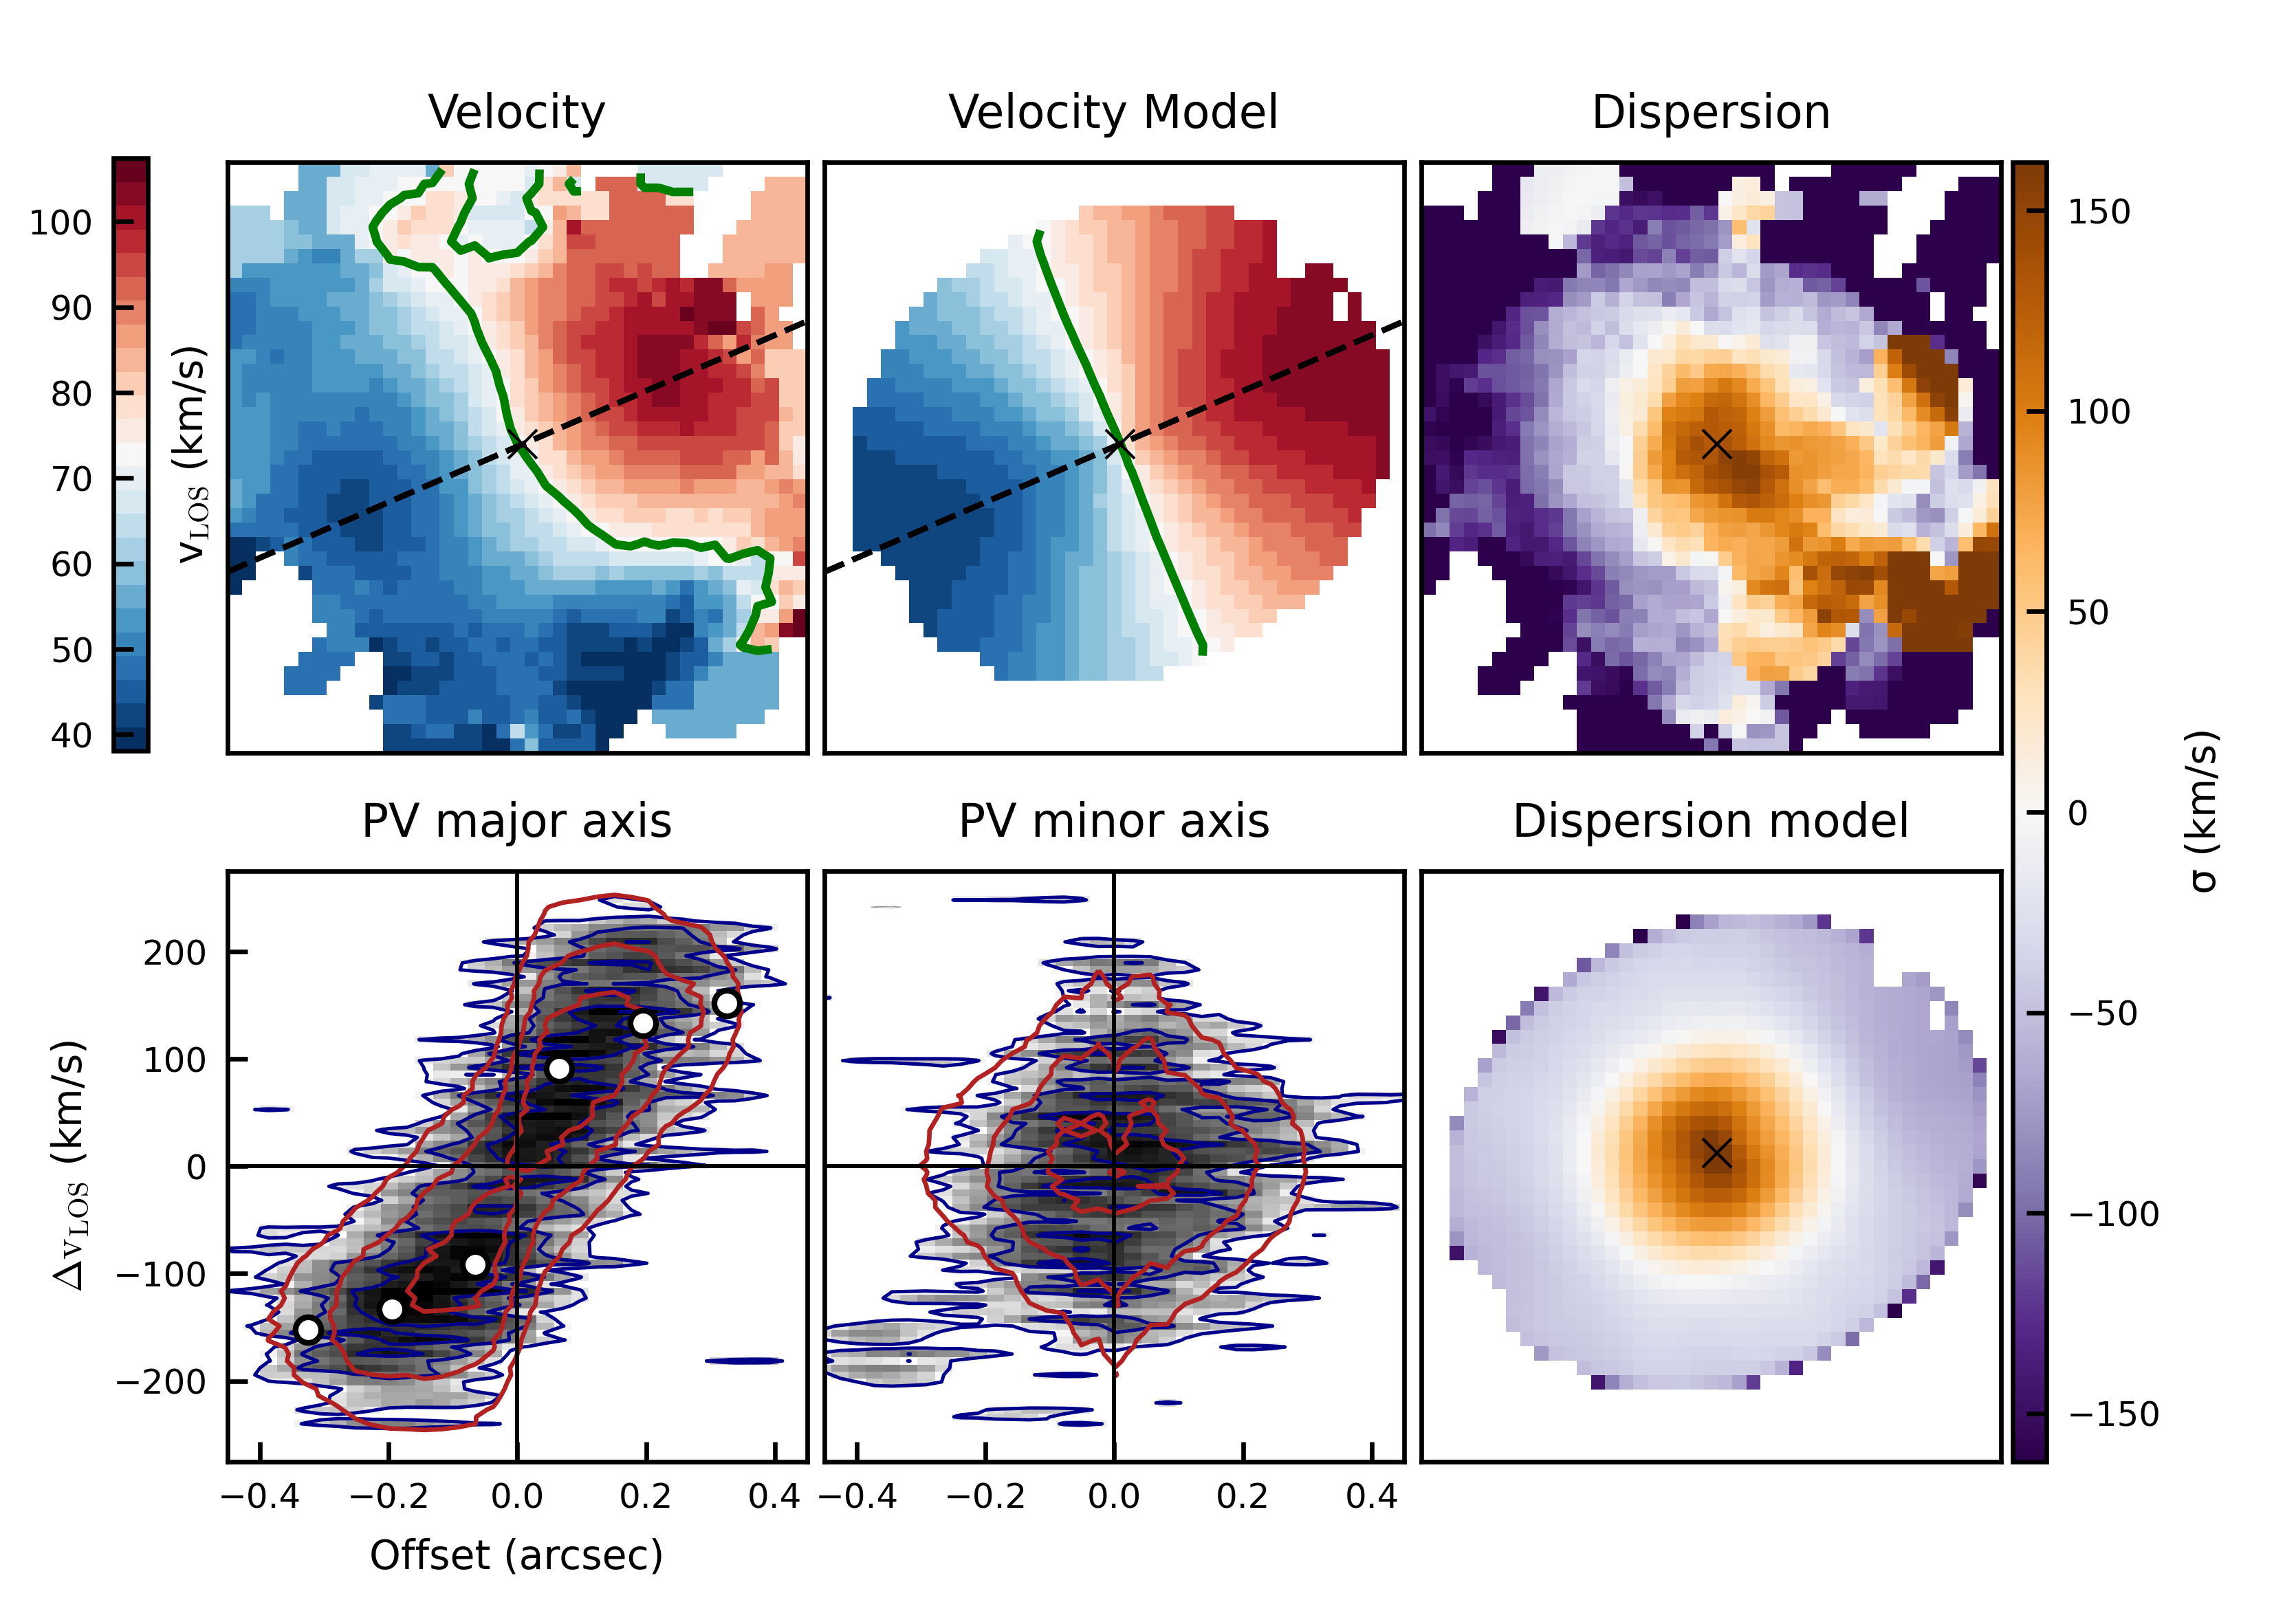
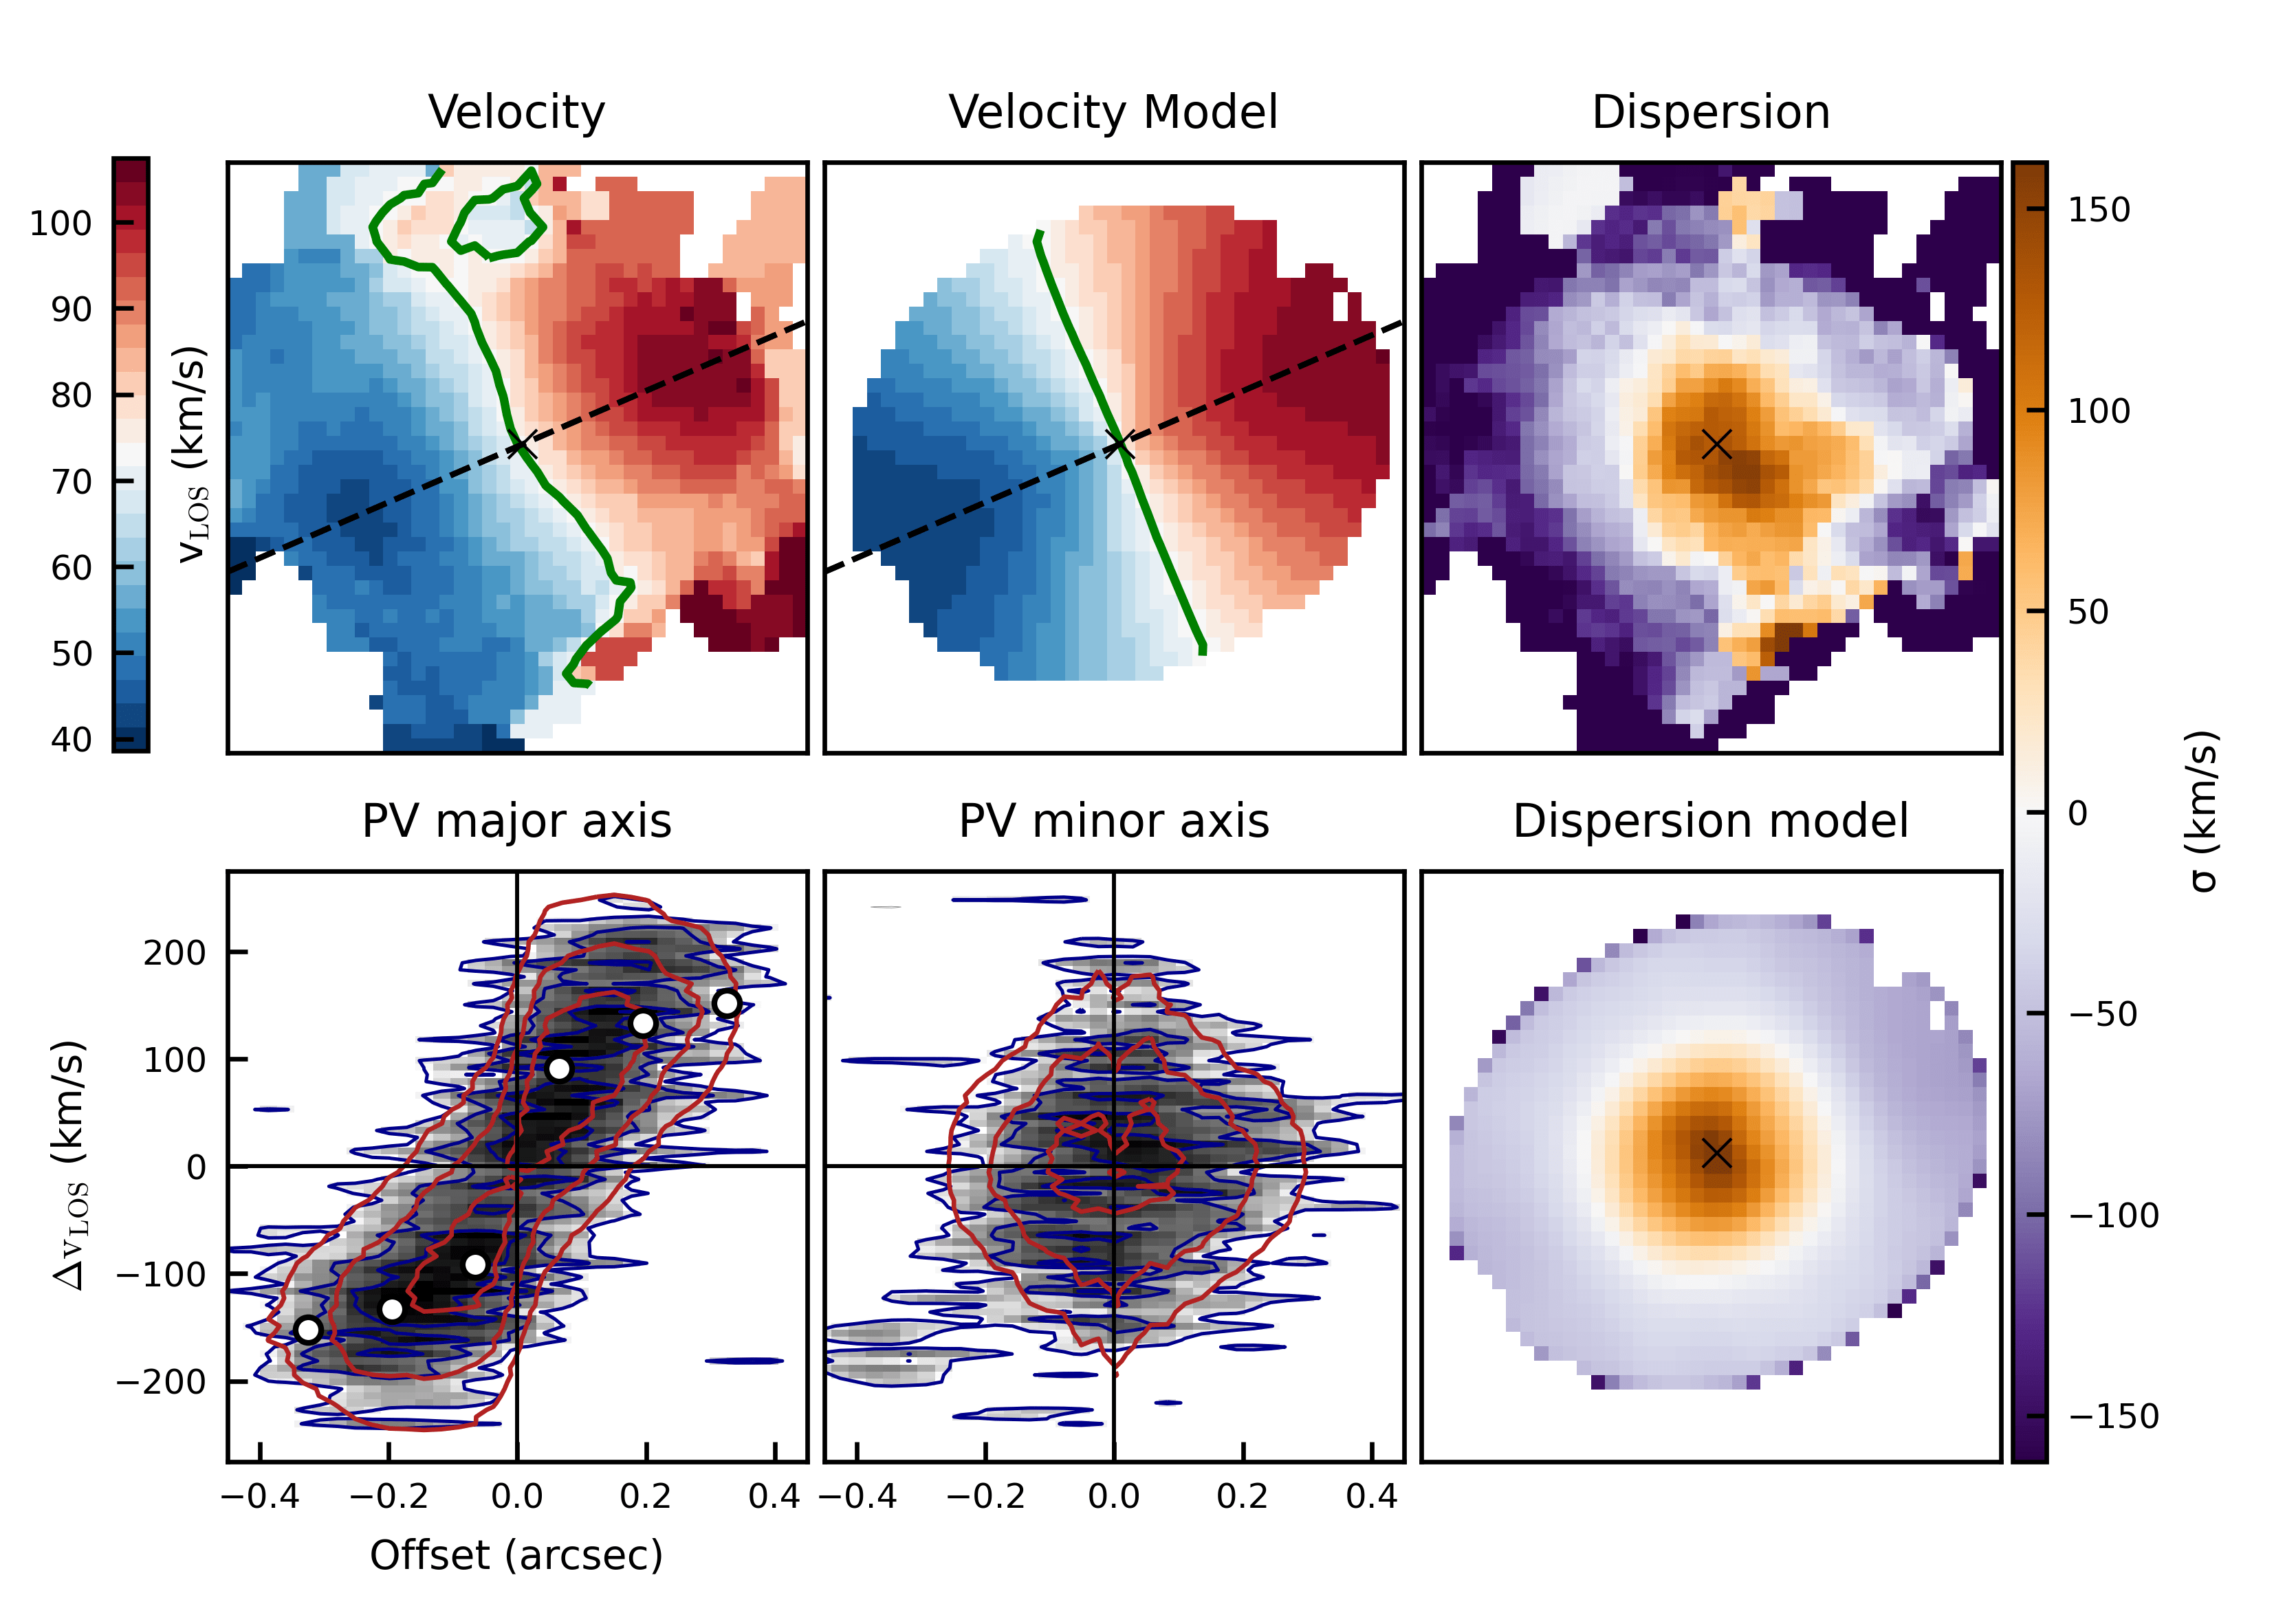
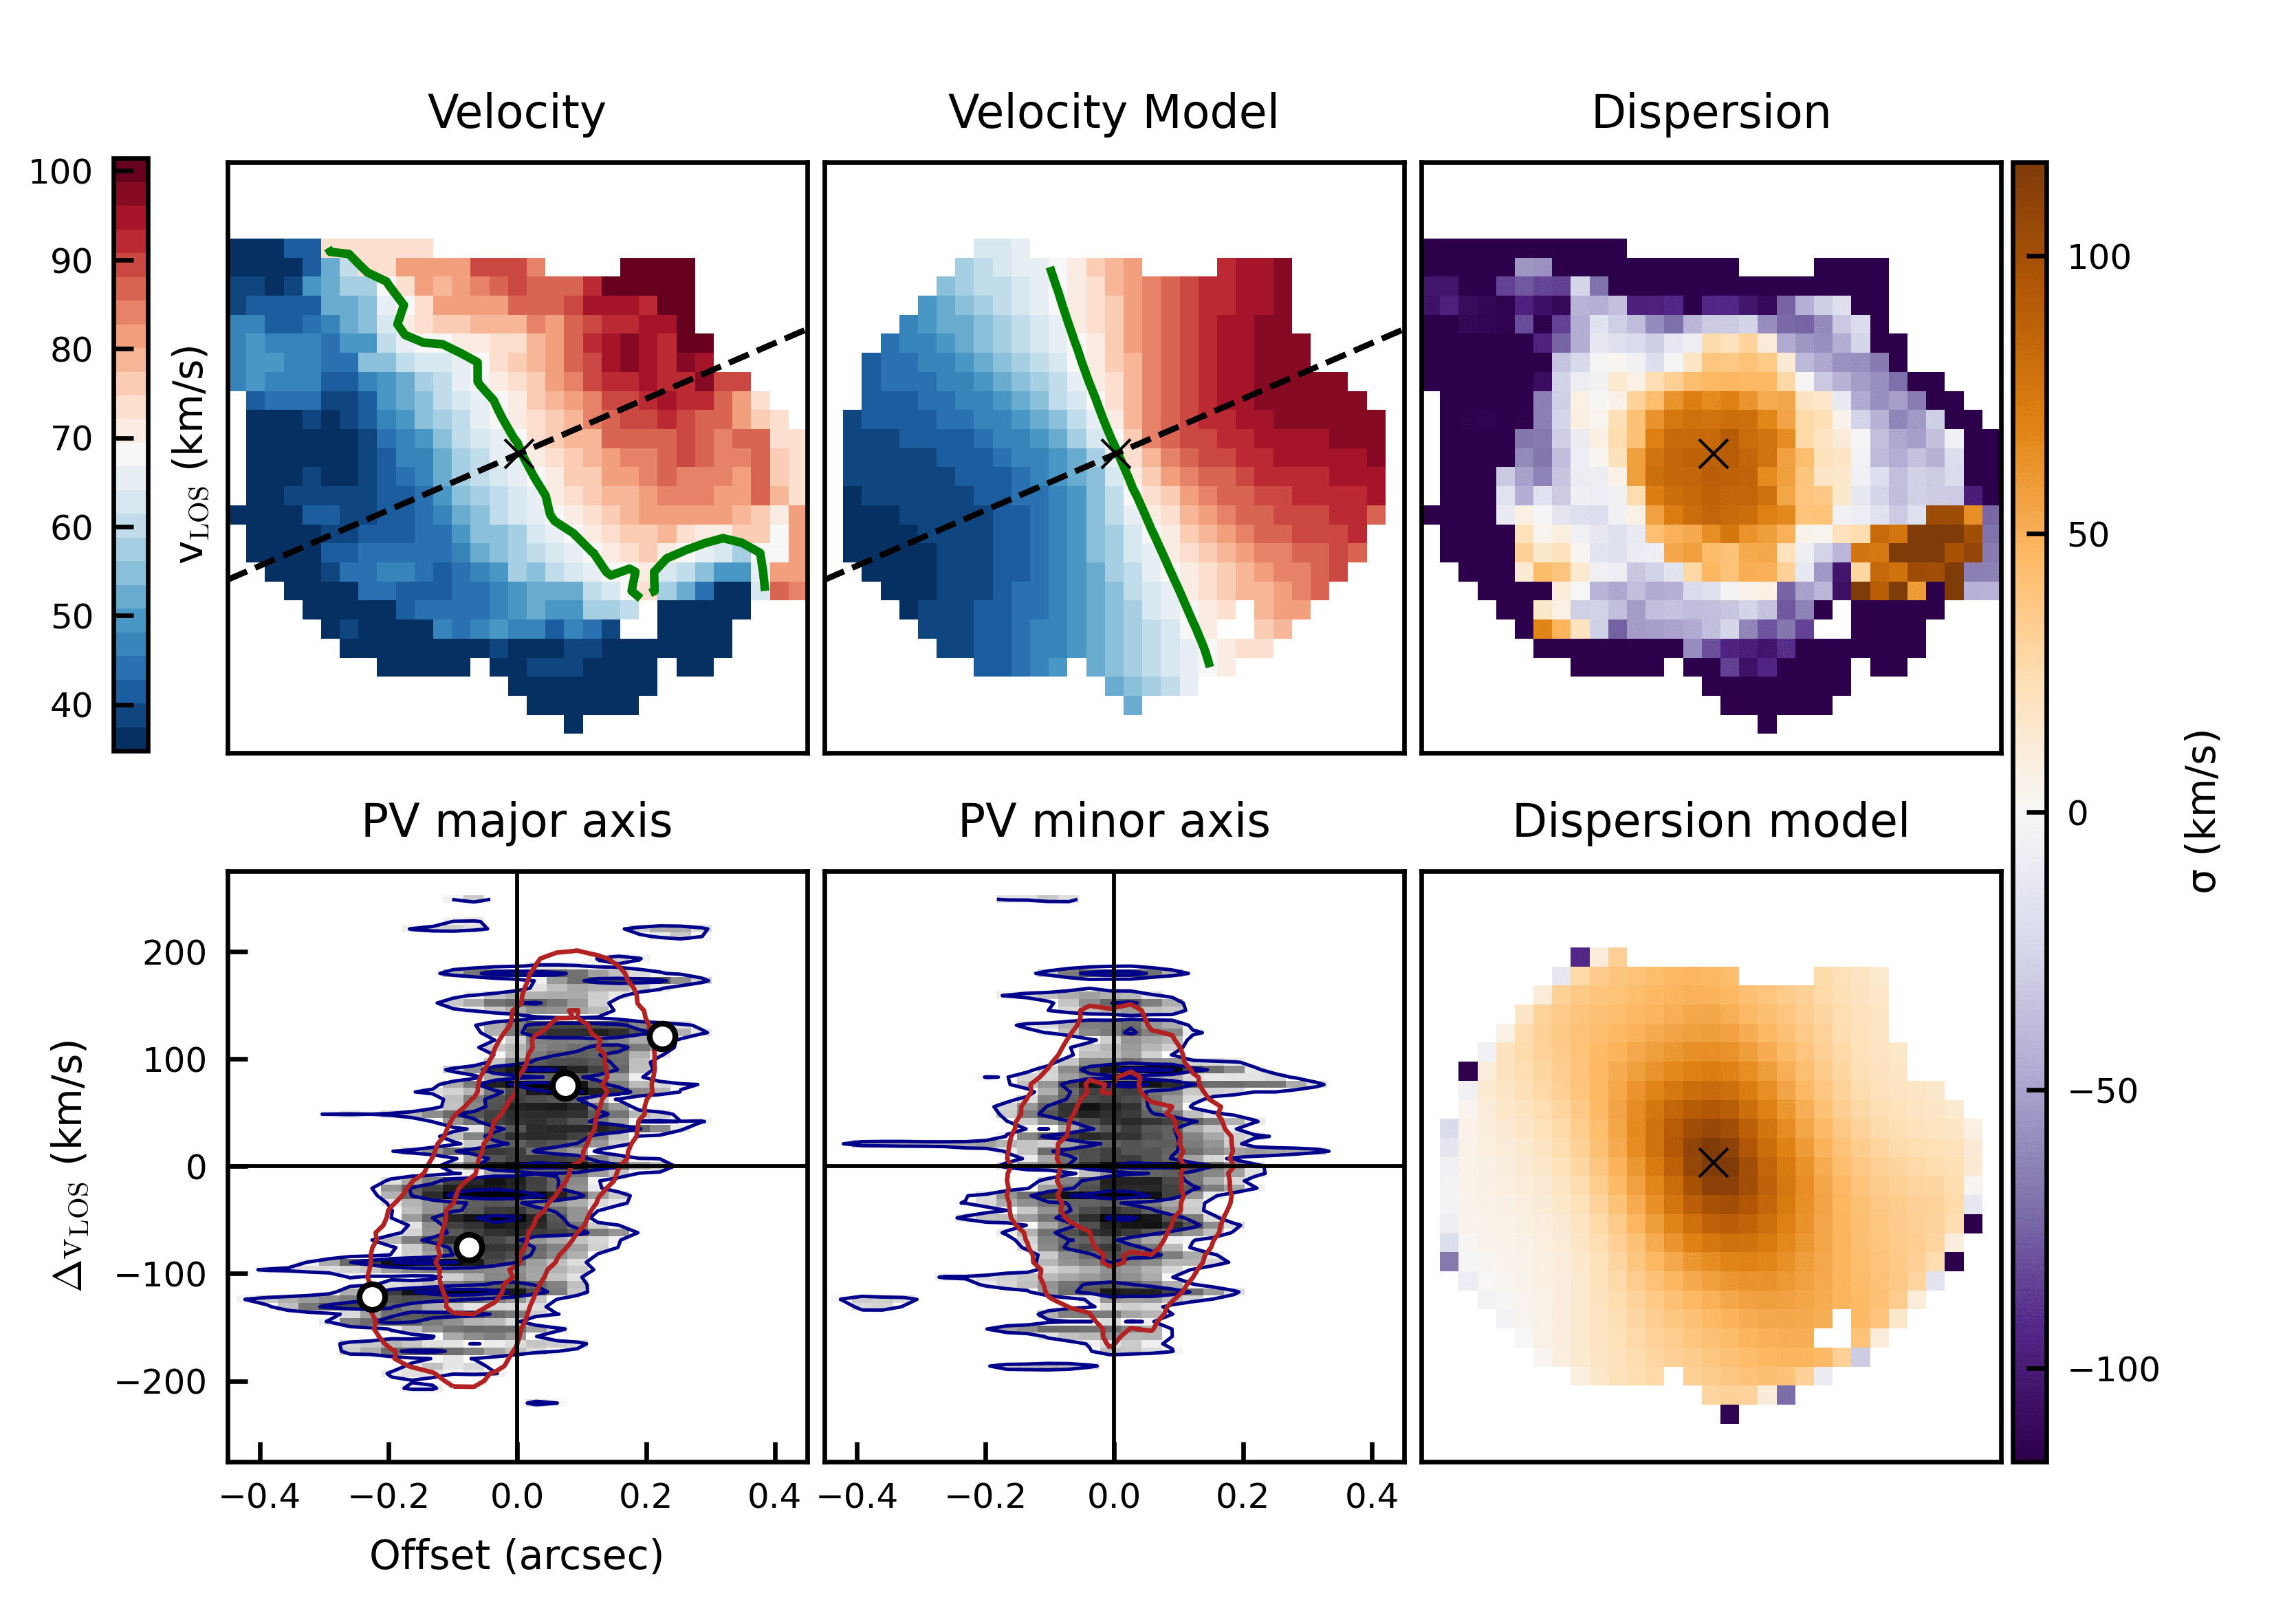
Figure Fig. 8 displays the total flux maps for the
[CII] and CO data. Figure Fig. 10 shows the data and models
produced by \(^\textit{3D}\)BAROLO for
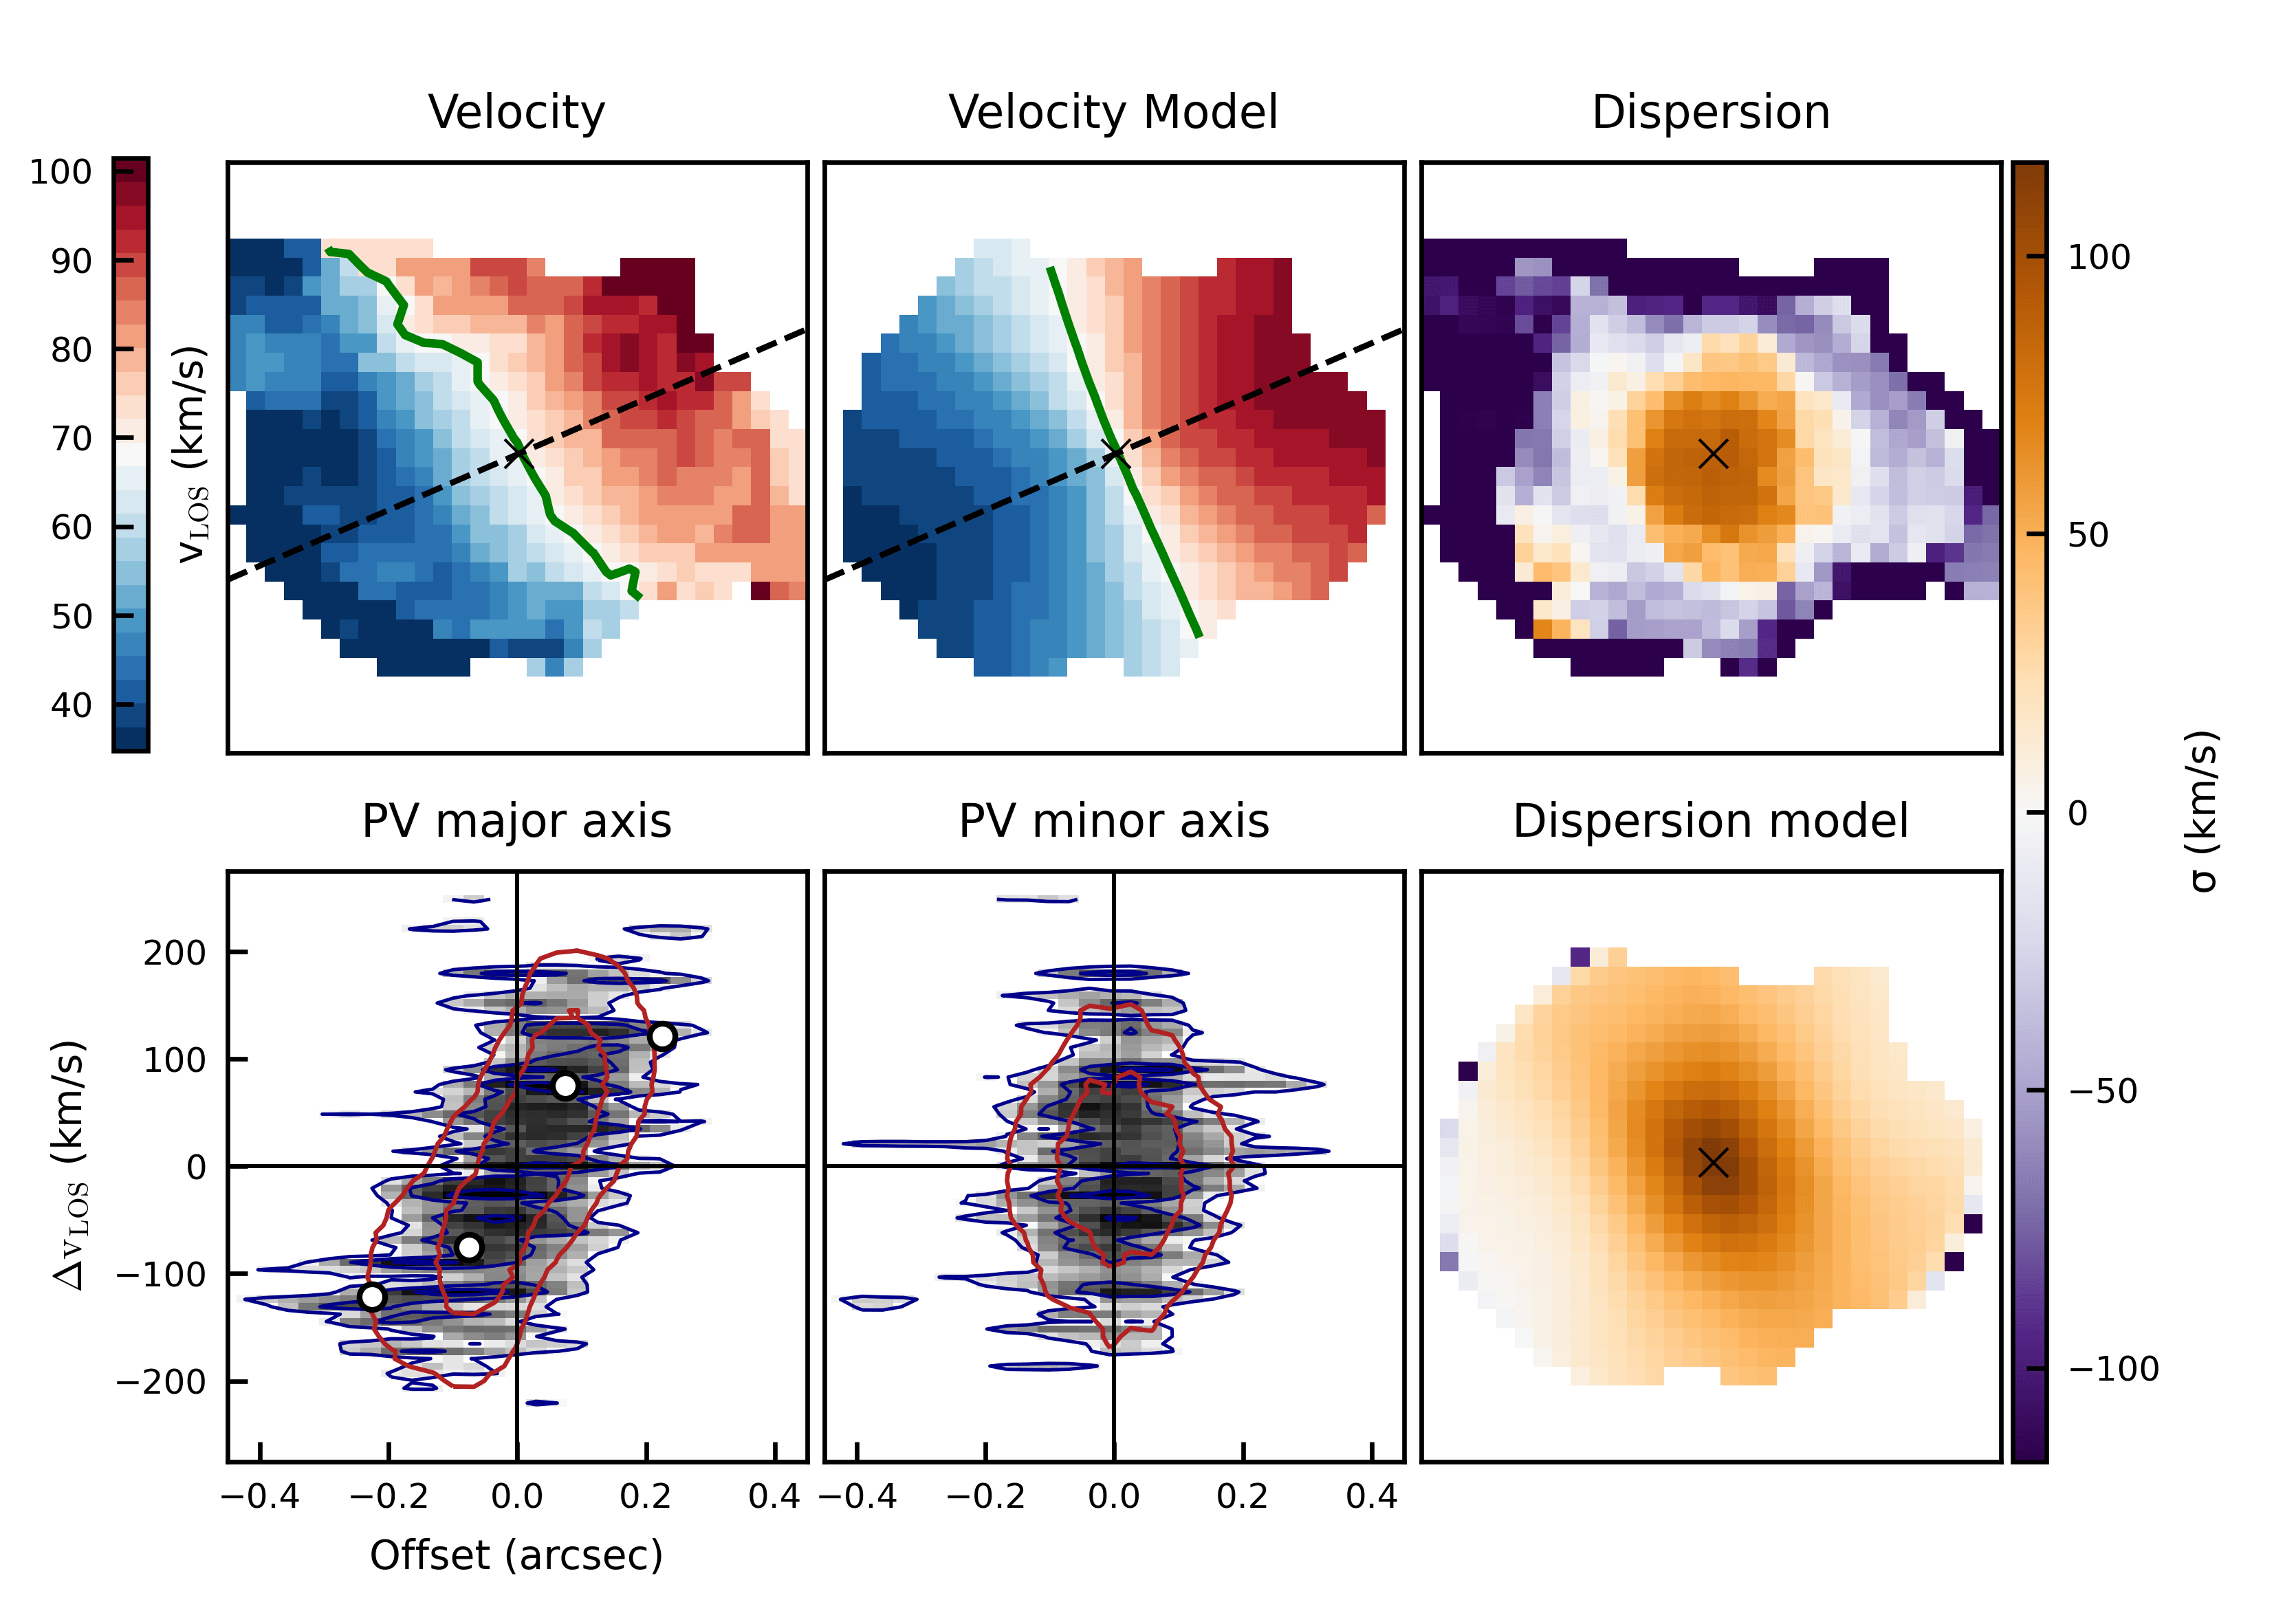
the [CII] tracer, while Figure Fig. 11
shows the same plots for the same tracer with the non-corotating
component masked out. Each figure presents the
1st moment map of the
line-of-sight (LOS) velocity, which provides a visual diagnostic of the
rotation of the galaxy, and the 2nd moment maps, that is, the
velocity dispersion maps for the data and the model. Finally,
the position-velocity (PV) diagrams show the LOS velocity with
respect to the kinematic centre along the major and
minor axes; the white dots mark the fitted rotation curve.
The non-corotating clump appears as extended emission along
the PV minor axis around \(-200\) km s\(^{-1}\), as seen in Figure Fig. 31. The models with and
without the clump are essentially the same. They appear visually identical in Figures Fig. 10
and Fig. 11, and this is confirmed in
Figure Fig. 12, which compares the
rotation velocity and velocity dispersion curves for the two
fiducial [CII] models and shows that both produce similar rotation and
dispersion behaviour.
We also produce fiducial kinematic models for the CO tracer. Figures
Fig. 14 and Fig. 15 again show the LOS velocity field, velocity dispersion field and PV diagrams along
the major and minor axes, together with the model counterparts. The CO emission is less extended than the [CII], which limits us to a reliable fit of only two rings, compared to the three rings used for the more extended [CII] emission.
The non-corotating component is also much less prominent in
the CO, making it harder to draw conclusions about its
effect on the gas disc.
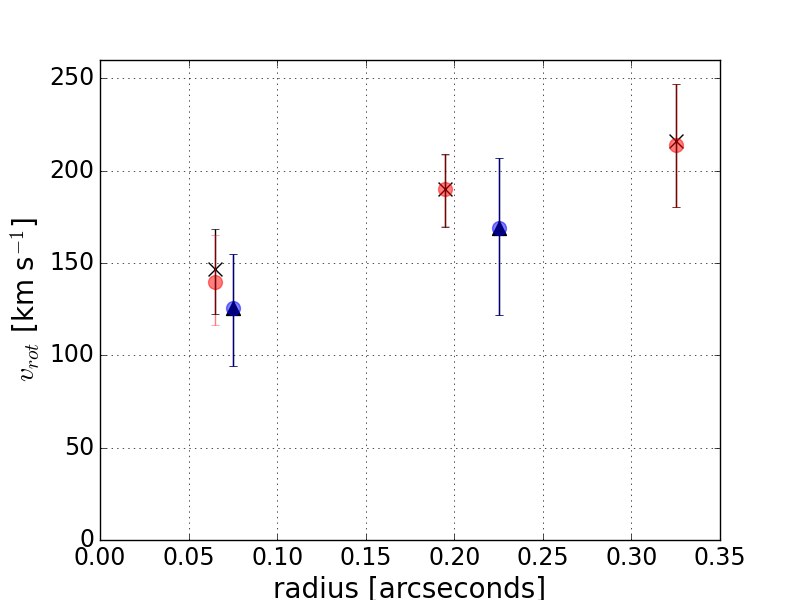
Even with fewer fitted values, the kinematic behaviour of the CO is consistent within the uncertainties with the [CII] models. As Figure Fig. 12 shows, the non-corotating
clump has almost no effect on the fitted rotation velocity or
dispersion. Table 5 lists the
rotation and dispersion velocities produced by the fiducial
models in [CII] and CO together with their ratios, comparing models with and without the clump for both tracers. In both
lines there is essentially no difference between the models with the
clump masked and those without.
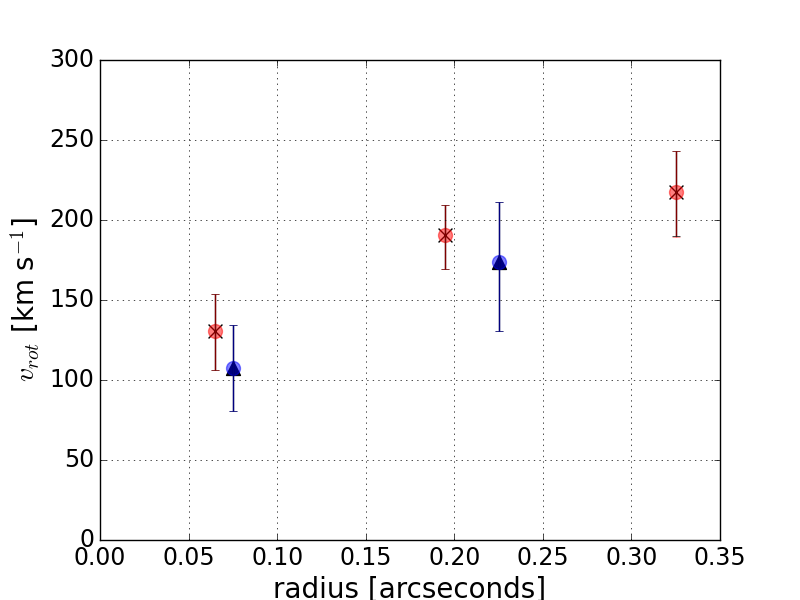
We find rotation-to-dispersion ratios of \(V/\sigma =2.6_{-0.6}^{+0.6}\) in [CII]
and \(V/\sigma=1.9_{-0.8}^{+0.7}\) in
CO. This difference is partly explained by the greater extension
of the [CII] emission relative to the CO, which yields a larger
maximum rotation velocity of \(217.4_{-27.8}^{+26.1}\) km s\(^{-1}\) compared to \(173.8_{-43.4}^{+37.7}\) km s\(^{-1}\) for CO, since the [CII] emission
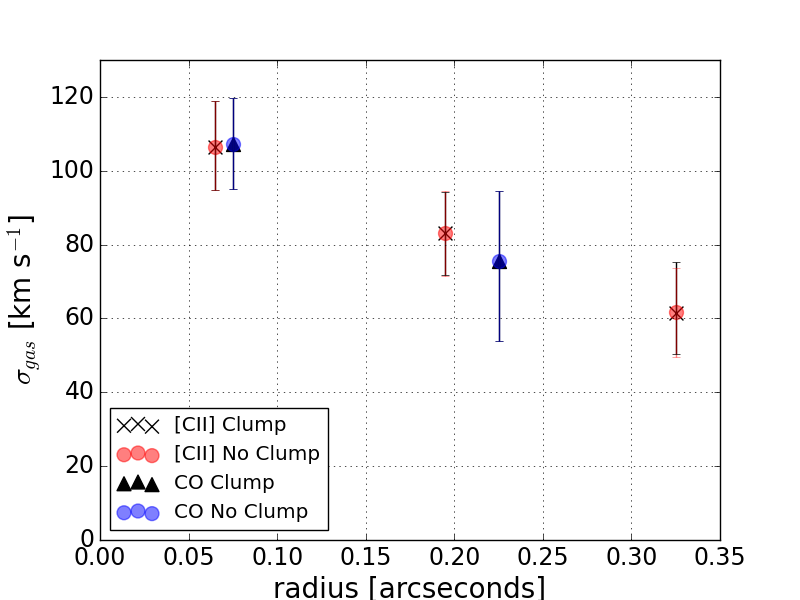
better traces the flat part of the curve (see Figure Fig. 12). The [CII] also shows a
slightly lower average velocity dispersion of \(83.7_{-6.8}^{+7.0}\) km s\(^{-1}\) compared to \(91.5_{-12.6}^{+11.3}\) km s\(^{-1}\) for CO, but the two values are
compatible within the uncertainties. As Figure Fig. 12 shows, the fitted values
for both tracers follow the same trend. We expect that more extended CO emission would yield values closer to those found in [CII]. We therefore conclude that [CII] and CO do not show clear kinematic
differences, since rotation velocity, dispersion and \(V/\sigma\) are consistent between
the two tracers within the uncertainties.
In Table 5 we note that the velocity dispersion in both tracers is larger than in previous results for
this galaxy. The PV major-axis diagrams in all fiducial-model figures show that the model extends slightly too far in both the
negative and positive LOS velocity, that is, beyond the genuine galaxy
emission. We believe this is what inflates the fitted dispersion. A preliminary test on a [CII] data cube covering the same emission but with a larger velocity range gives a velocity dispersion of \(\sigma\approx50\) km s\(^{-1}\). Detailed conclusions based on the velocity dispersion are therefore unwise; it
is likely that AzTEC-1 is even more rotation-dominated than our kinematic modelling implies.
We have shown that \(^\textit{3D}\)BAROLO is robust at
recovering the kinematics of rotating discs even in the presence of large regions of
non-corotating material. The differences in fitted
rotation velocity and velocity dispersion in Table 5 are very small: in all but one
case the difference is less than 0.1 km s\(^{-1}\), with the remaining case having a
difference of 0.1 km s\(^{-1}\). This
is a useful property, since many \(z\gtrsim 4\) galaxies are likely to experience
minor mergers during their evolution, and such mergers may resemble the non-corotating clump observed in AzTEC-1. We therefore conclude that \(^\textit{3D}\)BAROLO can reliably study the discs of
this galaxy population.
| \(\mathbf{V_\text{max}}\) [km s\(\mathbf{^{-1}}\)] | \(\mathbf{\sigma_\text{avg}}\) [km s\(\mathbf{^{-1}}\)] | \(\mathbf{{V}/{\sigma}}\) | ||
|---|---|---|---|---|
| CII | Including Clump | \(217.4_{-27.5}^{+26.1}\) | \(83.7_{-6.6}^{+7.3}\) | \(2.6_{-0.6}^{+0.6}\) |
| Excluding Clump | \(217.3_{-27.8}^{+26.1}\) | \(83.7_{-6.8}^{+7.0}\) | \(2.6_{-0.6}^{+0.6}\) | |
| CO | Including Clump | \(173.8_{-43.4}^{+37.7}\) | \(91.5_{-12.6}^{+11.3}\) | \(1.9_{-0.8}^{+0.7}\) |
| Excluding Clump | \(173.8_{-43.4}^{+37.7}\) | \(91.5_{-12.6}^{+11.3}\) | \(1.9_{-0.8}^{+0.7}\) |
3.4 Radial motions
We also investigate the potential presence of radial motions in the
disc of AzTEC-1. Since \(^\textit{3D}\)BAROLO has difficulty
constraining three parameters simultaneously at these spatial
resolutions, we fix the velocity dispersion at \(\sigma=50\) km s\(^{-1}\) and fit only the rotation velocity
and radial velocity. We start from an initial guess of \(v_\text{rad}=0\) km s\(^{-1}\).
Figures Fig. 16 and Fig. 17 show the results of
modelling the disc in [CII] with masks that include and exclude the
clump respectively. These models differ noticeably from
the fiducial case. The minor-axis PV plot
shows a clear asymmetry compared with that seen in Figures Fig. 10, Fig. 11, Fig. 14 and Fig. 15. In the bottom-left
quadrant of both minor-axis PV plots in Figures Fig. 16 and Fig. 17 the model extends toward the region of the clump. The same behaviour is mirrored in the top-right quadrant because \(^\textit{3D}\)BAROLO is forced to
produce a symmetric model. The model velocity fields in the bottom-right
panels of Figures Fig. 16 and
Fig. 17 show a wiggle along the
kinematic minor axis that partially reproduces the wiggle seen in the data (top-left panels).
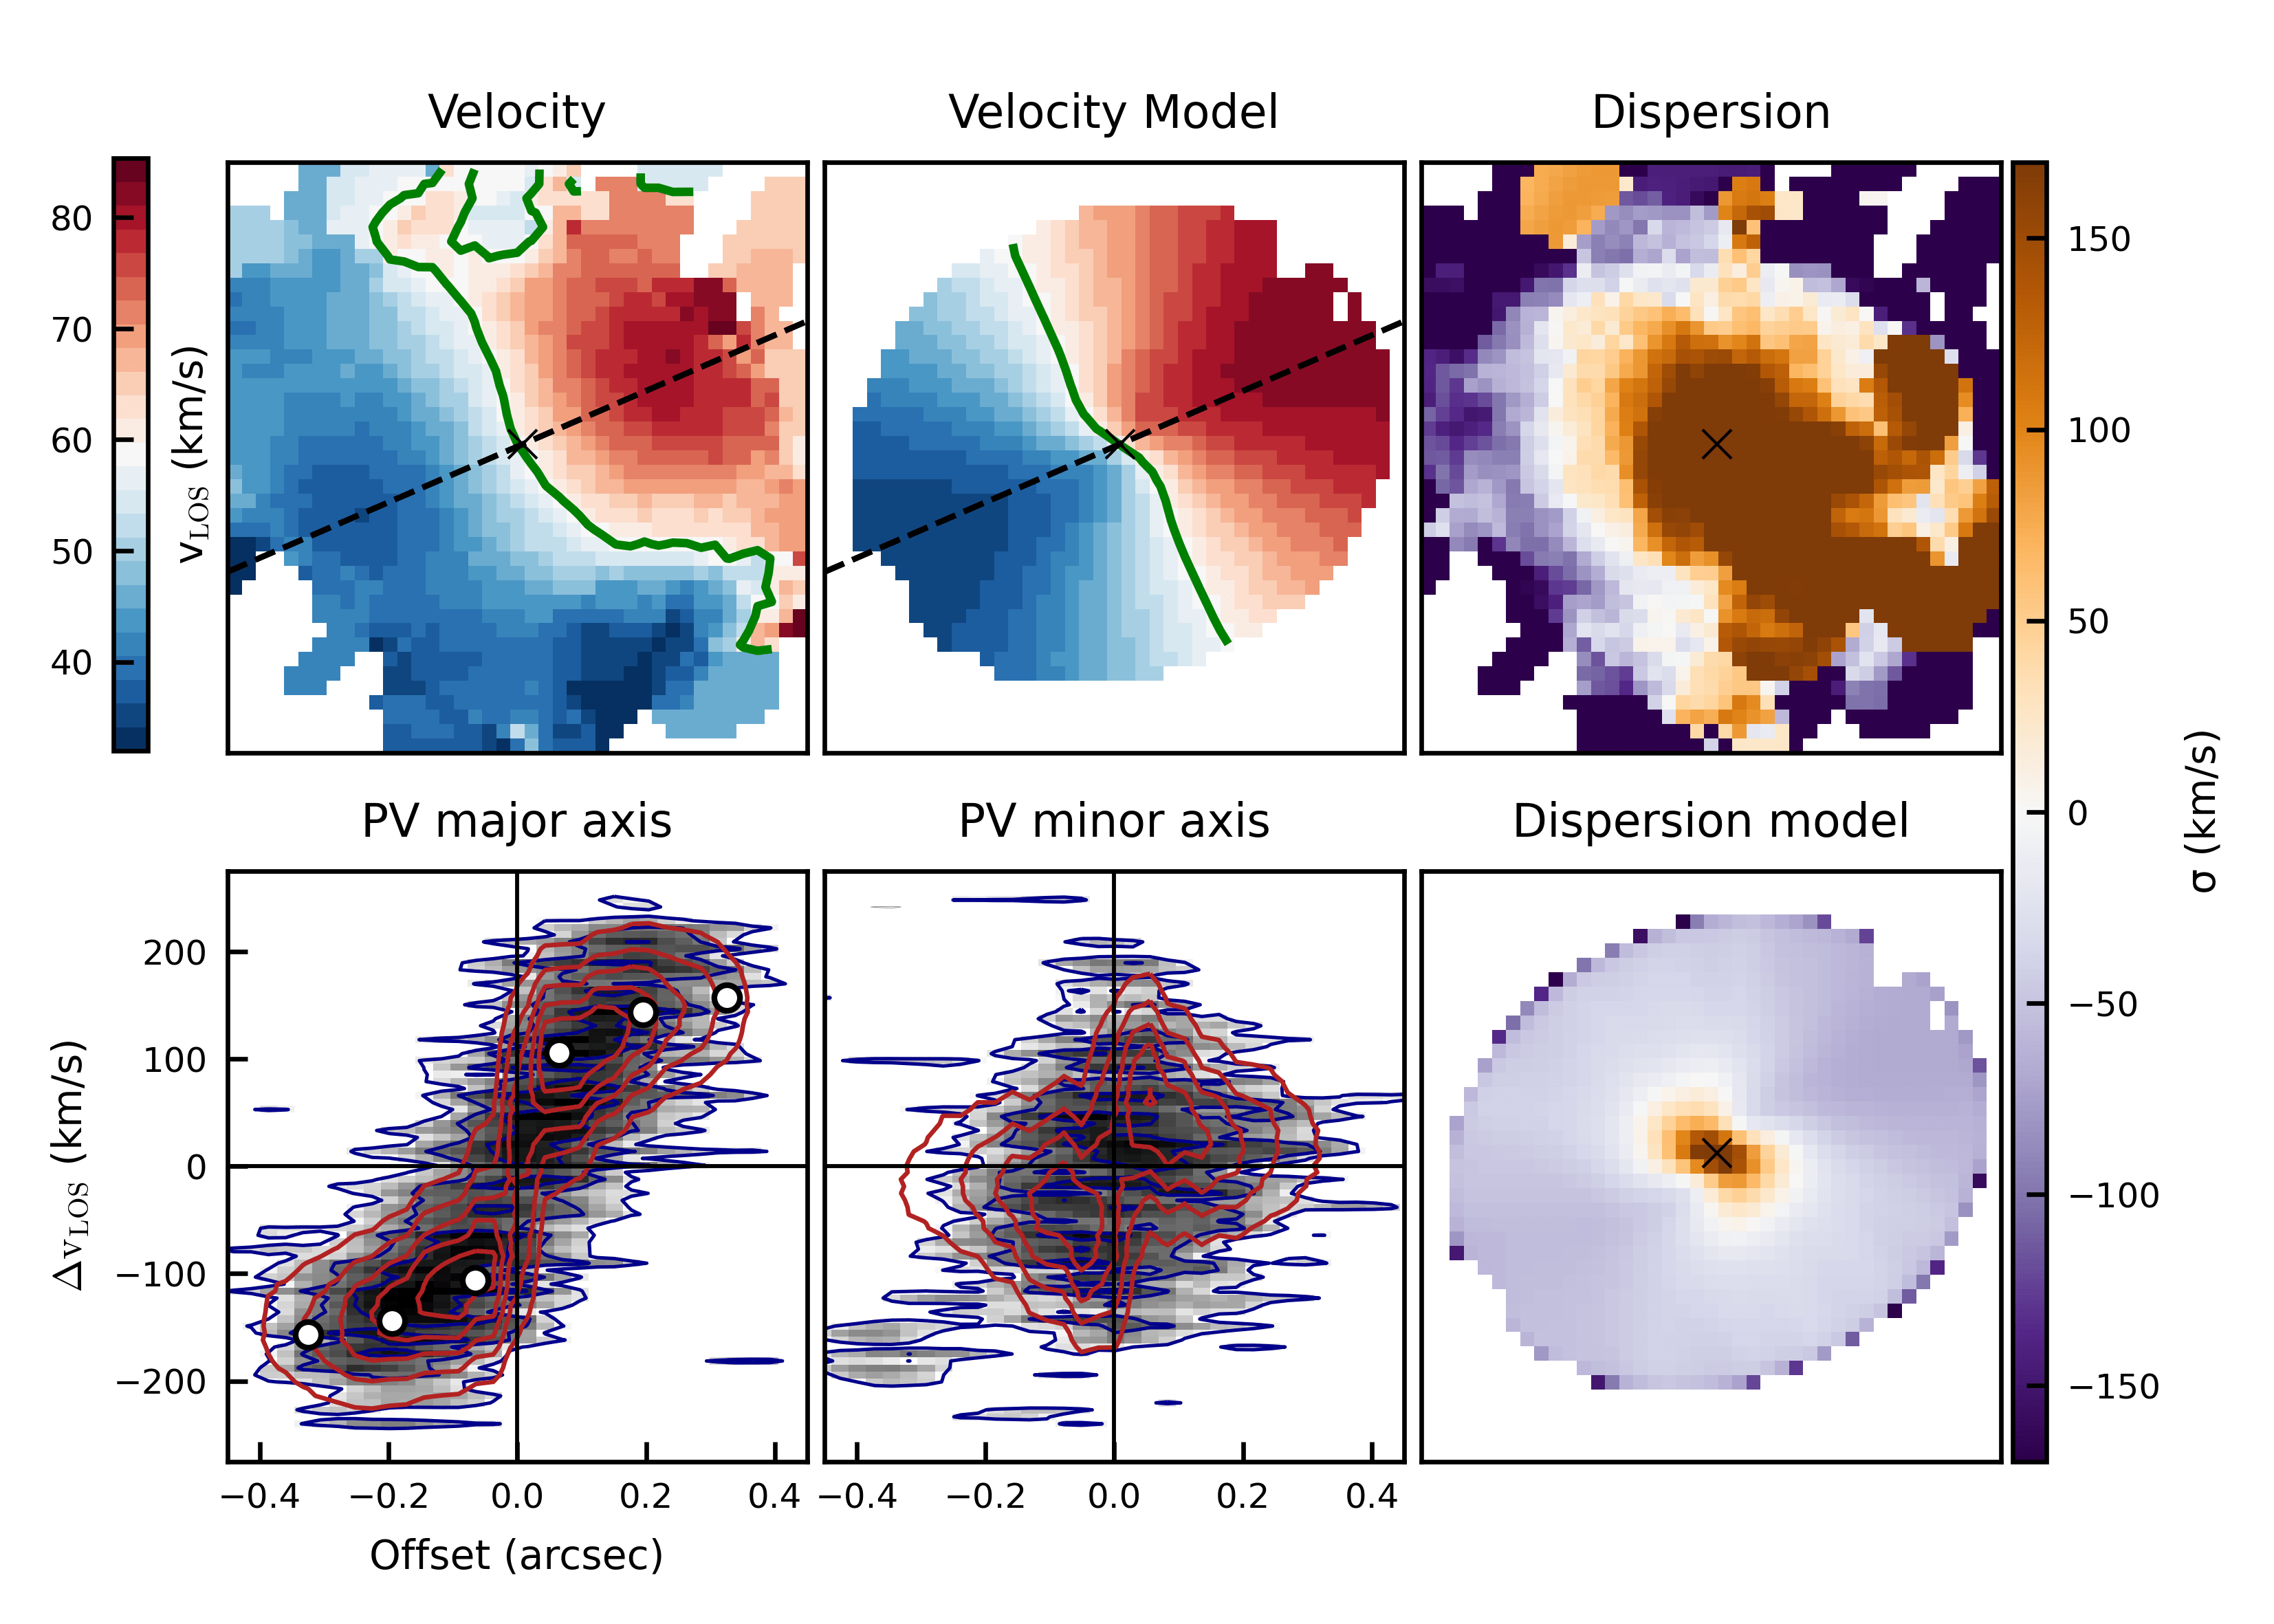
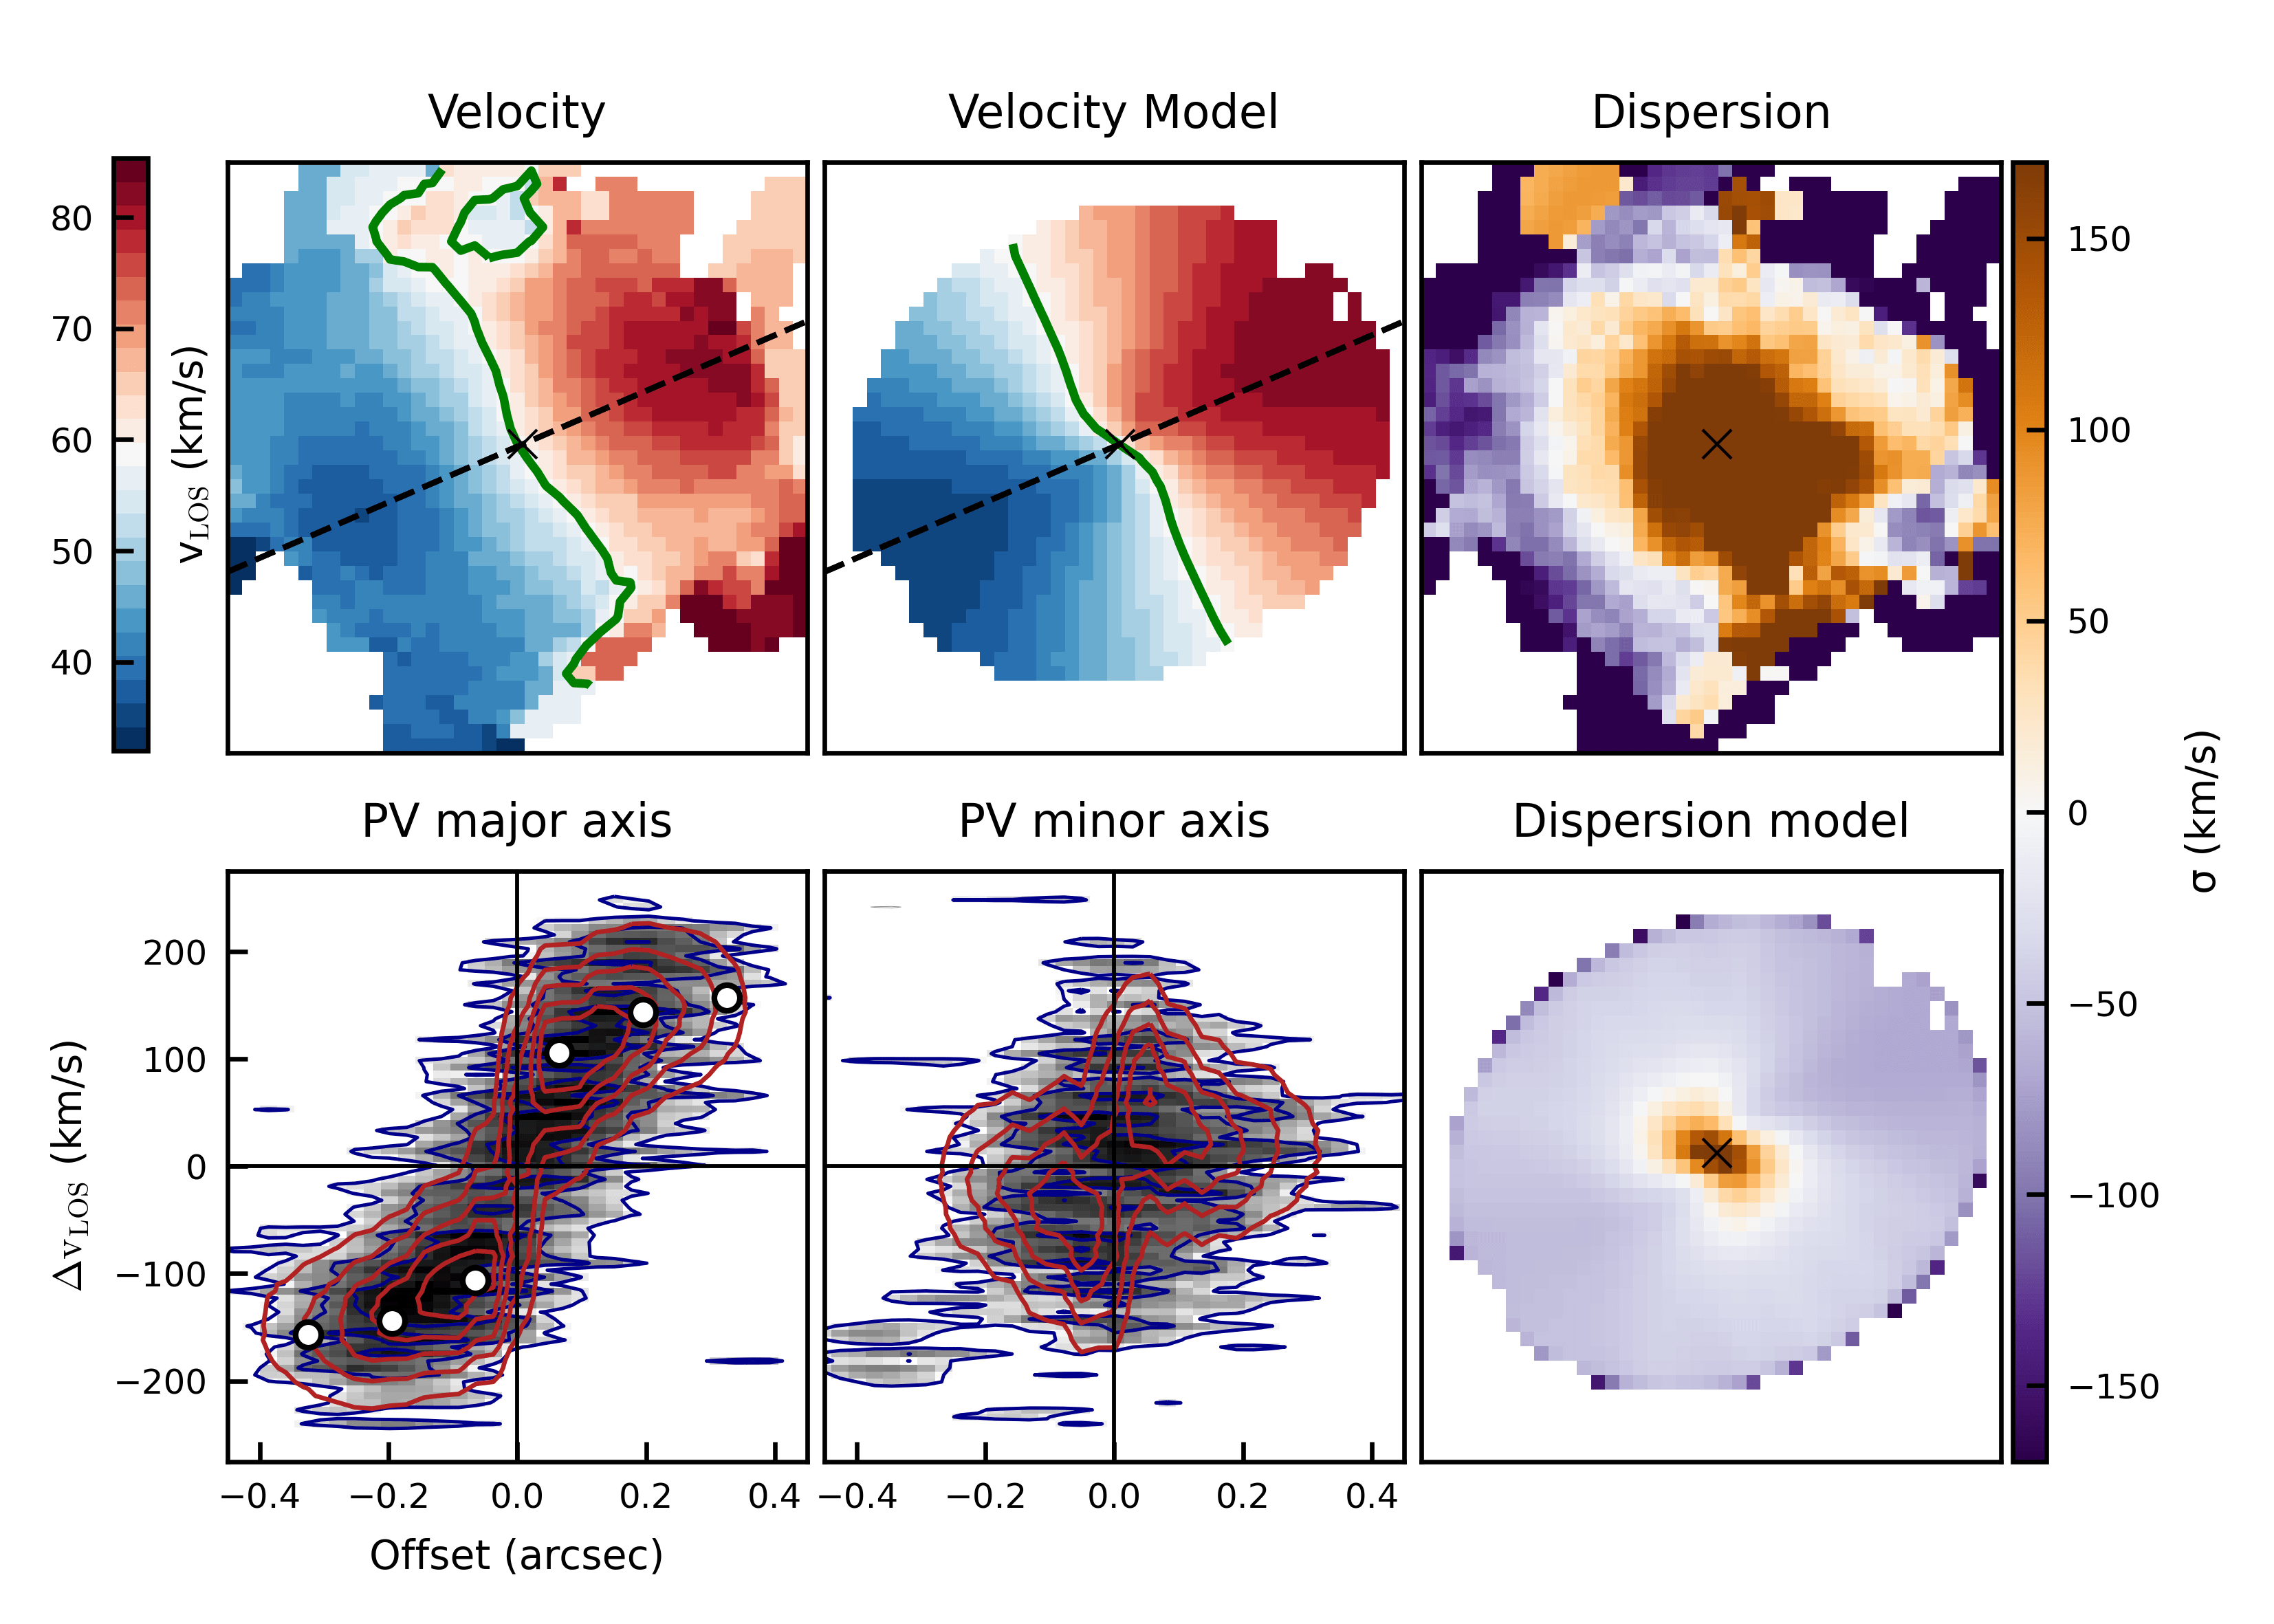
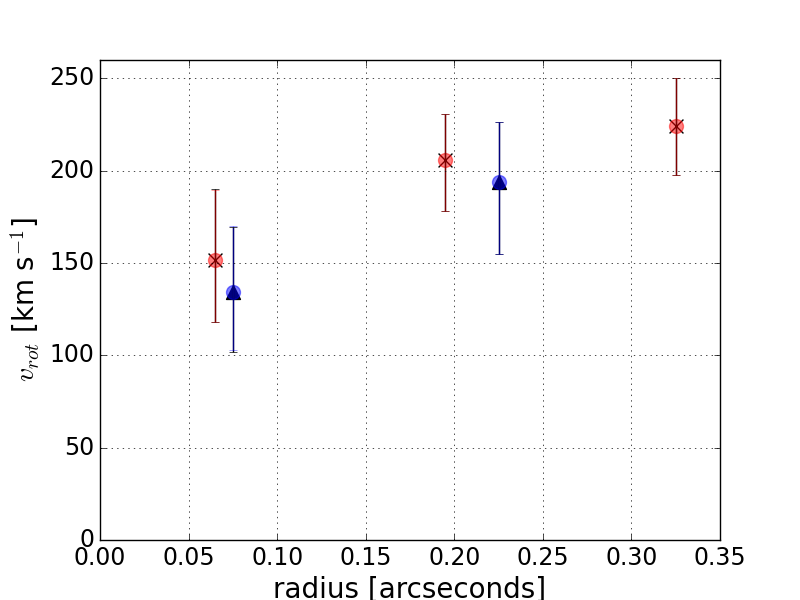
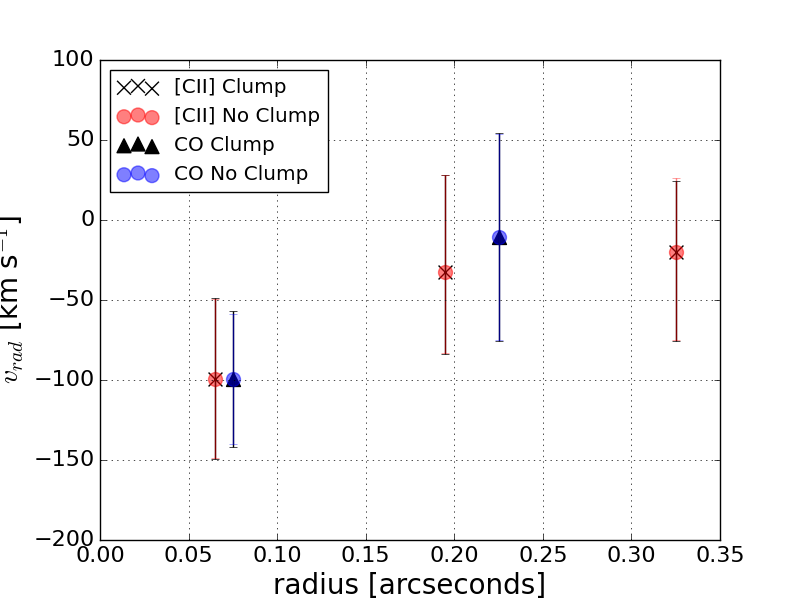
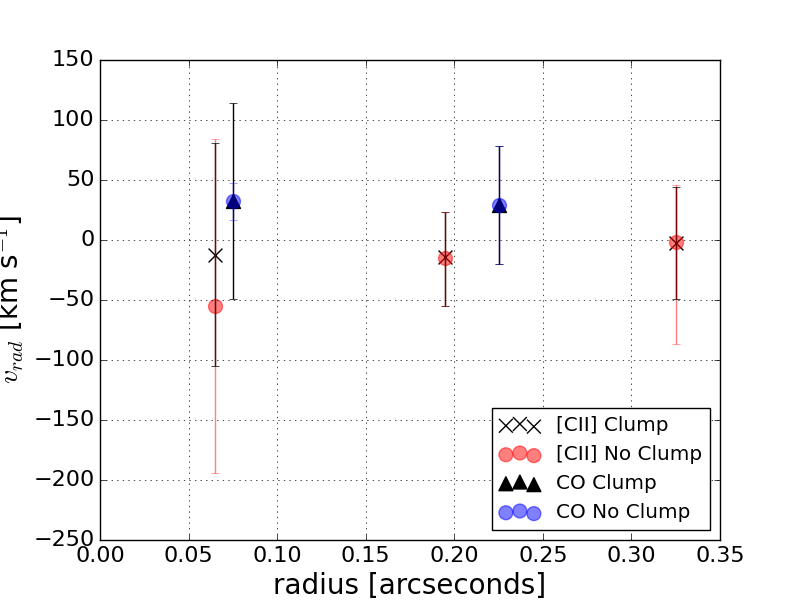
Figure Fig. 18 shows the rotation and radial velocity curves for this model in both cold gas tracers. The uncertainties are large, but both tracers show broadly the same behaviour, namely a negative radial velocity across the
whole disc. We cannot determine whether this corresponds to inflow or outflow without knowing which side of the galaxy is the near side. As a motion across the whole disc, however, an inflow seems more likely. An alternative
possibility is the presence of a bar in this galaxy,
producing non-circular motions in a bar potential, although the present data make this very difficult to investigate. A further, more speculative possibility is that these radial motions are
produced by the perturbation from the clump,
potentially a minor merger.
We performed a further test in which the initial guess for
the radial velocity was set to \(v_{rad} =
20\) km s\(^{-1}\). This
lets us check whether, given a positive initial value, \(^\textit{3D}\)BAROLO still recovers a
broadly negative radial velocity in [CII], which would indicate that the [CII] result is robust to the choice of initial guess. The models are
included in the appendix; the results are shown in
Figure Fig. 18. The
positive initial guess has a much larger impact on the CO
fit than on the [CII]: the [CII] values remain slightly negative,
albeit with large uncertainties, while the CO values turn positive with
similarly large uncertainties. The resolution of the data is probably insufficient to constrain the radial velocity, leaving the CO fit
too sensitive to the initial guess for any firm conclusion to be drawn about radial motions in CO.
4 Conclusions
In this thesis we applied the three-dimensional tilted-ring kinematic
modelling code \(^\textit{3D}\)BAROLO
to [CII] and CO observations of AzTEC-1, an SMG at \(z=4.342\). Because \(^\textit{3D}\)BAROLO accounts for
observational biases, in particular beam smearing, the code was able to
determine the kinematics and geometry of this high-redshift galaxy,
particularly well in the [CII] tracer.
We characterised the kinematics of the galaxy and found a rotation
velocity \(V_\text{max}=217.3_{-27.8}^{+26.1}\) km
s\(^{-1}\) and gas velocity dispersion
of \(\sigma=83.7_{-6.8}^{+7.0}\) km
s\(^{-1}\), giving \(V/\sigma= 2.6_{-0.6}^{+0.6}\). Inspection
of the PV diagrams suggests, however, that the velocity dispersion is
an overestimate. A preliminary test on a larger velocity-space cube indicates a value of \(\sigma\approx50\) km s\(^{-1}\), which is likely to be more
realistic. This would yield a larger \(V/\sigma\) than the value reported here, so AzTEC-1 is more rotation-dominated than our fits suggest and
certainly possesses a dynamically cold gas disc. We also determined a disc
inclination of \(44.36\degree_{-2.91}^{+2.29}\). This value
is now well constrained, having been obtained from a robust MCMC inclination-fitting code.
We also tested \(^\textit{3D}\)BAROLO's ability to
model a galaxy hosting a large region of non-corotating material. The code proved very robust: the differences
in fitted rotation velocity and velocity dispersion between models that include and exclude the
non-corotating clump are less than \(0.1\) km s\(^{-1}\) (see Table 5). Galaxies at \(z\gtrsim 4\) are likely to experience minor
mergers, and the code has shown that it can retrieve the kinematics of such
galaxies.
(Schreiber et al. 2009)
We investigated radial motions across AzTEC-1's disc using two initial guesses for the radial velocity, \(v_\text{rad}=0\) km s\(^{-1}\) and \(v_\text{rad}=20\) km s\(^{-1}\), with the value at each ring then constrained
by \(^\textit{3D}\)BAROLO. The code
preferentially fitted systematically negative radial velocities. With a slightly positive initial guess, however, the CO fits became slightly positive, with
large uncertainties. If the radial motions are real, an inflow is the most likely interpretation, since coherent outflow across the entire disc would be unusual. Another possibility is that the motions are caused by the perturbation from the non-corotating clump (potentially a minor merger), although this remains speculative. We could also be observing non-circular motions associated with a bar component, but this cannot be investigated with the current data.
References
Available at http://galpak.irap.omp.eu/↩︎
Available at https://editeodoro.github.io/Bbarolo/↩︎
Available at https://www.atnf.csiro.au/computing/software/karma/↩︎
Available at https://spectral-cube.readthedocs.io/en/latest/index.html↩︎
Available at https://bbarolo.readthedocs.io/en/latest/↩︎
Available at https://sites.google.com/cfa.harvard.edu/saoimageds9/home↩︎
Available at http://www.public.asu.edu/~rjansen/linux/mkmask_hlp.html↩︎